
|
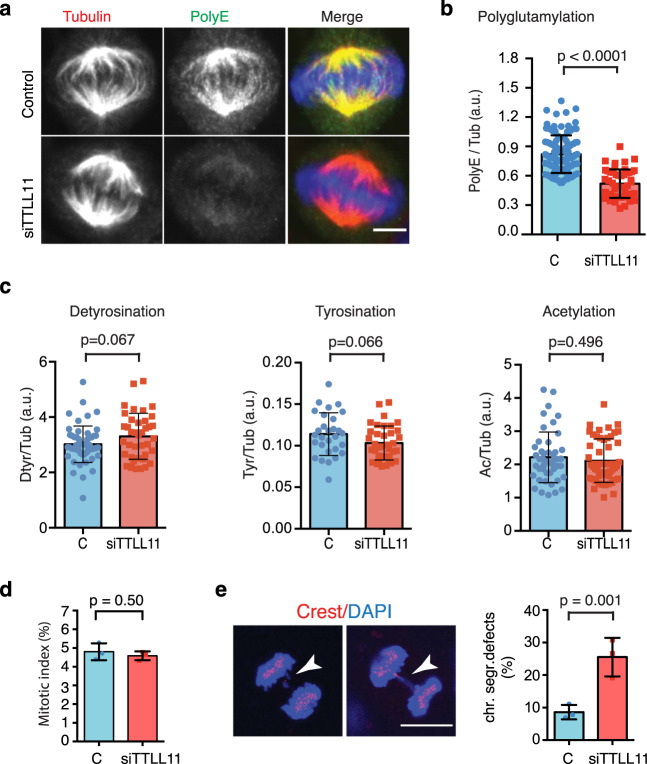
Fig. 1 a Immunofluorescence images of metaphase spindles in control and siTTLL11 HeLa cells, showing PolyE (green), tubulin (red) and DNA (blue). Scale bars, 10 μm. b Quantification of the polyE signal normalized to the total tubulin signal in control and siTTLL11 spindles. n (control) = 105 cells and n (siTTLL11) = 50 cells. Graph representative of N = 5 independent experiments. Data are presented as mean values + /− SD. c Quantification of immunofluorescence signal for detyrosinated, tyrosinated and acetylated tubulin normalized to the total tubulin signal in control and siTTLL11 spindles. Detyrosination: n (control) = 55 cells and n (siTTLL11) = 39 cells; Tyrosination: n (control) = 29 cells and n (siTTLL11) = 37 cells. Acetylation: n (control) = 37 cells and n (siTTLL11) = 37 cells. Graphs representative of N = 3 independent experiments. Data are presented as mean values +/− SD. d Mitotic index in control and siTTLL11 cells. n = 1000 cells per condition; N = 3. e Immunofluorescence images of two siTTLL11 anaphase cells showing chromosome segregation defects including a lagging chromosome (white arrows). Kinetochores were labeled with CREST (red) and DNA with DAPI (blue). Quantification of lagging chromosome frequency in control and siTTLL11 anaphase cells. n (control) = 349 and (siTTLL11) = 270 cells examined over N = 3 independent experiments. Scale bar, 15 μm. Data are presented as mean values +/− SD. All P values are based on unpaired two-sided t test with 95% confidence. Source data are provided as a Source Data file.