
- Title
-
Tamalin Function Is Required for the Survival of Neurons and Oligodendrocytes in the CNS
- Authors
- Seo, Y., Mo, S., Kim, S., Kim, H., Park, H.C.
- Source
- Full text @ Int. J. Mol. Sci.

ZFIN is incorporating published figure images and captions as part of an ongoing project. Figures from some publications have not yet been curated, or are not available for display because of copyright restrictions. PHENOTYPE:
|
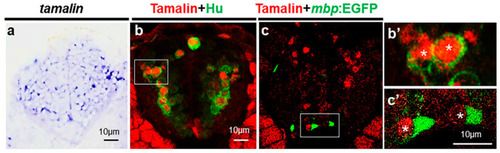
Tamalin is expressed in the neurons but not in the oligodendrocytes. (a–c’) The representative images are transverse sections of the spinal cord. The dorsal side is displayed at the top. (a) Whole-mount in situ RNA hybridization with tamalin mRNA in the spinal cord of wildtype zebrafish at 3 dpf. (b,b’) Immunolabeling of wildtype zebrafish with anti-Hu and anti-tamalin antibodies, and (c,c’) the immunolabeling of Tg(mbp:egfp) zebrafish with an anti-Tamalin antibody at 5 dpf. (b’,c’) High magnification images of the boxes in (b,c). Asterisks indicate the tamalin+ cells. Scale bars: (a–c’), 10 μm. EGFP, Enhanced green fluorescent protein; dpf, days post fertilization. EXPRESSION / LABELING:
|
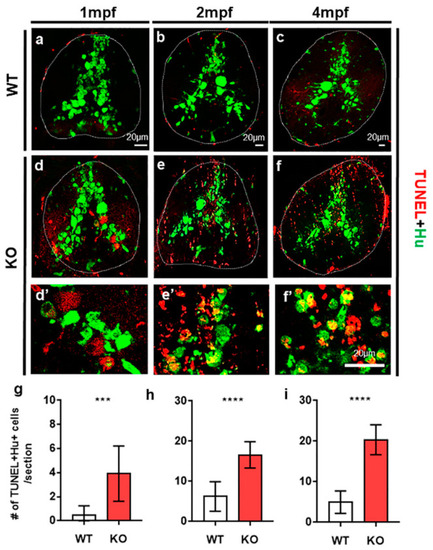
The loss of tamalin function causes neuronal cell death in the spinal cord of postembryonic zebrafish up to adulthood. (a–f) The representative images are transverse sections of the spinal cord of wildtype (a–c) and tamalin KO zebrafish (d–f) labeled with anti-Hu antibody (green) and TUNEL staining (red). (d’–f’) High magnification images of the boxed area in (d–f) show TUNEL+ Hu+ dying neurons. The dorsal side is displayed at the top. (g–i) Quantification of the number of TUNEL+ Hu+ cells in the wildtype or tamalin KO zebrafish at 1 mpf, 2 mpf, and 4 mpf (*** p = 0.0007 **** p < 0.0001, n = 10 sections from five zebrafish). Scale bars: (a–f), 20 µm. KO, knockout; mpf; months post fertilization; and TUNEL, terminal deoxynucleotidyl transferase dUTP nick end labeling. PHENOTYPE:
|

The loss of tamalin function causes cell death of oligodendrocyte lineage cells in the postembryonic zebrafish spinal cord to adulthood. The representative images are transverse sections of the spinal cord of post-embryonic zebrafish. The dorsal side is displayed at the top. (a–f) Immunolabeling of wildtype (a–c) and tamalin KO (d–f) zebrafish with anti-Olig2 antibody (green) and TUNEL staining (red). (j–o) Immunolabeling of wildtype (j–l) and tamalin KO zebrafish (m–o) with anti-PCNA (green) and anti-Olig2 (red) antibodies. Quantification of the number of TUNEL+ Olig2+ cells (g–i) and PCNA+ Olig2+ cells (p–r) at 1 mpf (g,p), 2 mpf (h,q), and 4 mpf (i,r). (** p = 0.002 **** p < 0.0001, n = 10 sections from five zebrafish). Scale bars: (a–l), 20 μm. KO, knockout; TUNEL, terminal deoxynucleotidyl transferase dUTP nick end labeling; PCNA, proliferating cell nuclear antigen; ns; no significance and mpf; months post fertilization. PHENOTYPE:
|
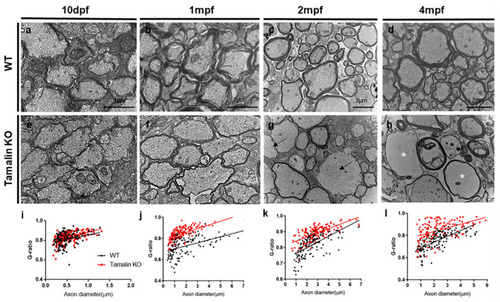
Tamalin KO causes the hypomyelination of axons in the zebrafish spinal cord. Transmission electron microscopy (TEM) images reveal transverse sections through the spinal cord of wildtype or tamalin KO zebrafish at 10 dpf (a,e), 1 mpf (b,f), 2 mpf (c,g), and 4 mpf (d,h). Black arrows indicate unmyelinated axons (g), and asterisks indicate disorganized watery axons (h). (i–l) The g-ratio of myelinated axons in the spinal cord of wildtype and tamalin KO zebrafish. Unpaired t test was used to compare means from each animal. Each g-ratio has been obtained from 100 myelinated axons in eight sections of four zebrafish each (i: p = 0.0696, j–l: p < 0.0001). Scale bars: (a,e): 1 μm, (b–h): 2 μm. KO, knockout; dpf, days post fertilization; and mpf; months post fertilization. |

Tamalin KO induces nerve degeneration and hypomyelination in the postembryonic mouse brain. (a–h) TEM images displaying transverse sections of the corpus callosum (a,b,e,f) and pyramidal tract (c,d,g,h) at 3 weeks (a,e,c,g) and 12 weeks (b,f,d,h) in wildtype and tamalin KO mice. (i–l) The g-ratio of myelinated axons in the corpus callosum (i,j) and pyramidal tract (k,l) of wildtype and tamalin KO zebrafish. Unpaired t test was used to compare means from each animal. Each g-ratio was from 100 myelinated axons in eight sections of four mice each (i: p = 0.0535, k: p = 0.0579, j,l: **** p < 0.0001). (m–p) Quantification of the number of nerve cells in the corpus callosum (m,o) and pyramidal tract (n,p) of wildtype and tamalin KO mice (**** p < 0.0001, *** p < 0.001). ns; no significance. Scale bars: (a–h): 1 μm. KO, knockout; TEM, transmission electron microscopy. |
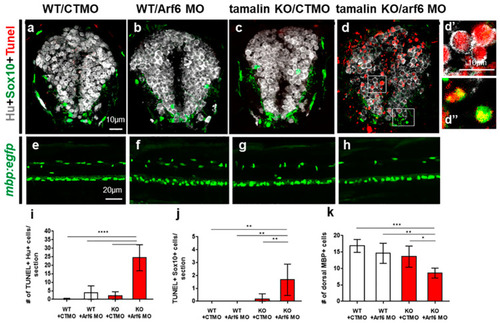
The loss of tamalin and Arf6 synergistically induces neuronal and oligodendrocyte degeneration during CNS development. (a–d) The representative images are transverse sections of the spinal cord at 3 dpf. The dorsal side is displayed at the top. Wildtype embryos injected with control MO (CTMO) (a) and Arf6 MO (b), or tamalin KO embryos injected with CTMO (c) and Arf6 MO (d) have been immunolabeled with anti-Hu (white) and anti-Sox10 (green) antibodies to detect neurons and oligodendrocyte lineage cells, respectively, and TUNEL staining (red) to detect apoptotic cell death. (d’,d”) High magnification images of the boxes in (d). (e–h) Lateral views of the spinal cord of 3 dpf Tg(mbp:egfp) zebrafish injected with CTMO (e) and Arf6 MO (f), or tamalin KO zebrafish injected with CTMO (g) and Arf6 MO (h). The anterior side is displayed on the left. (i–k) Quantification of the number of TUNEL+/Hu+ neurons (i), TUNEL+/Sox10+ oligodendrocyte lineage cells (j) and MBP+ mature oligodendrocytes (k). (**** p < 0.0001, *** p < 0.001, ** p < 0.01, * p < 0.05). Scale bars: (a–d”), 10 μm (e–h), 20 μm (a–d: n = 10 sections from five zebrafish, (e–h): each image from ten zebrafish). KO, knockout; MO, morpholino oligonucleotides; CNS, central nervous system; dpf, days post fertilization; TUNEL, terminal deoxynucleotidyl transferase dUTP nick end labeling; Sox10, Sry-related HMg-Box gene 10; Arf6, ADP-ribosylation factor 6; and MBP, myelin basic protein. PHENOTYPE:
|
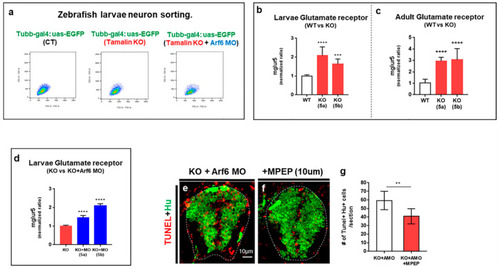
The loss of tamalin and Arf6 synergistically induces the upregulation of glutamate receptor expression. (a) The isolation of tubb:EGFP+ neurons from the spinal cord of Tg(tubb:gal4;uas:egfp), Tg(tubb:gal4;uas:egfp)/tamalin-/-, and Tg(tubb:gal4;uas:egfp)/tamalin-/-/arf6 MO-injected embryos by fluorescent activated cell sorting (FACS). (b) qRT-PCR analysis to compare mglur5a/5b expression level in the neurons isolated from the spinal cord of Tg(tubb:gal4;uas:egfp) and Tg(tubb:gal4;uas:egfp)/tamalin-/- embryos. (c) qRT-PCR analysis to compare mglur5a/5b expression levels in the spinal cord of adult Tg(tubb:gal4;uas:egfp) and Tg(tubb:gal4;uas:egfp)/tamalin-/- zebrafish (*** p < 0.001 **** p < 0.0001). (d) qRT-PCR analysis to compare neuronal mglur5a/5b expression level isolated from the spinal cord of Tg(tubb:gal4;uas:egfp)/tamalin-/- and Tg(tubb:gal4;uas:egfp)/tamalin-/-/arf6 MO-injected larvae (**** p < 0.0001). (e,f) Transverse sections of the spinal cord of tamalin KO/Arf6 MO-injected embryos not treated € and treated with MPEP (f). Immunolabeling with anti-Hu antibody (green) and TUNEL staining (red) has been performed to detect neuronal apoptotic cell death. (g) Quantification of the number of Tunel+ Hu+ cells. (** p = 0.01). (e,f): n = 10 sections from five zebrafish. Scale bars: (e,f), 10 μm. EGFP, enhanced green fluorescent protein; MO, morpholino oligonucleotides; Qrt-PCR, quantitative real time polymerase chain reaction; Arf6, ADP-ribosylation factor 6; TUNEL, terminal deoxynucleotidyl transferase dUTP nick end labeling; and MPEP, 2-Methyl-6-(phenylethynyl)-pyridine. EXPRESSION / LABELING:
PHENOTYPE:
|