
- Title
-
osr1 Maintains Renal Progenitors and Regulates Podocyte Development by Promoting wnt2ba via the Antagonism of hand2
- Authors
- Drummond, B.E., Chambers, B.E., Wesselman, H.M., Gibson, S., Arceri, L., Ulrich, M.N., Gerlach, G.F., Kroeger, P.T., Leshchiner, I., Goessling, W., Wingert, R.A.
- Source
- Full text @ Biomedicines
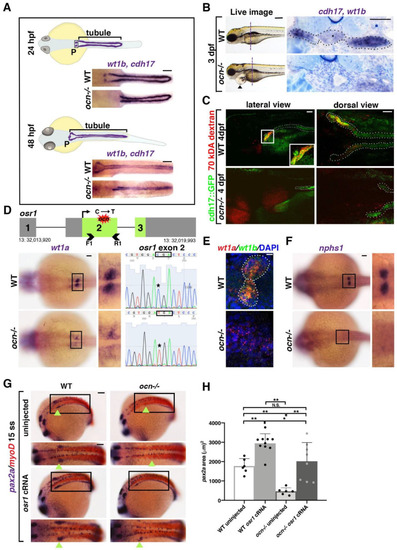
Figure 1. The ENU mutant ocn has a proximally abrogated pronephros due to a lesion in the gene osr1. (A) At 24 hpf, the zebrafish pronephros contains two clusters of podocytes (P) and two nephron tubules. By 48 hpf, the pronephros is functional as the podocyte progenitors have migrated to the midline and fused. In ocn−/− mutants, podocyte progenitors (wt1b) are reduced at both stages. The pronephric tubules (cdh17) were truncated at 24 hpf, which became more dramatic at 48 hpf. Scale bar is 50 μm. (B) A live time course of ocn revealed pericardial edema beginning at 72 hpf, as indicated by black arrow heads. This fluid imbalance was symptomatic of organ dysfunction. Scale bar is 70 μm. WISH experiments to view podocytes and tubules (wt1b, cdh17) were also conducted at 72 hpf. JB-4 serial sectioning was conducted on three WT and three ocn−/− embryos to examine the anterior pronephros; the location is marked by the dashed vertical line. WT siblings had an intact pronephros (dotted outline), including a glomerulus (asterisk) with two tubules. Mutant sections of this same region had no discernable blood filter or tubule structure. Scale bar is 50 μm. (C) At 48 hpf, ocn::cdh17::GFP embryos were injected with 70 kDA rhodamine dextran (red). These embryos were assessed at 96 hpf. Nephron tubules are shown by the dotted outline. WT siblings exhibited no edema and appeared to uptake the dextran in the proximal region, as indicated by yellow coloration (inset). However, in mutants with pericardial edema and truncated tubules, there was no evidence of dextran within the tubule, suggesting that active uptake was not occurring in these mutants. Scale bar is 15 μm for lateral images and 50 μm for dorsal views. (D) After assessment of the genetic candidates obtained via whole genome sequencing, osr1 appeared to be an attractive possibility due to a C to T SNP that was predicted to cause a premature stop codon. The predicted lesion (red shape) is located in exon 2 of osr1. We designed primers that flanked exon 2 (arrow heads) for Sanger sequencing. Embryos with reduced wt1a WISH staining exhibited a “TGA” codon within exon 2 of osr1 that is normally a “CGA” codon in WT embryos. Scale bar is 30 μm. (E) To confirm that wt1a+ podocytes were reduced in ocn−/−, FISH with wt1a and wt1b was performed at 24 hpf. There were little to no double-positive cells seen in genotype-confirmed mutants, whereas both clusters of wt1a/b+ podocytes were evident in WT embryos. Scale bar is 10 μm. (F) The slit diaphragm marker nphs1 was similarly reduced in 24 hpf ocn mutants. Scale bar is 50 μm. (G,H) At the 15 ss, pax2a marks the developing IM, the beginning of which is shown with green arrowheads. In ocn−/−, the anterior region of pax2a is decreased. When ocn−/− was injected with osr1 cRNA, pax2a expression was restored. Interestingly, pax2a was significantly expanded in WT embryos injected with osr1. Absolute area measurements of pax2a were taken from somites 1–5. p-values: ** p < 0.001, * p < 0.05, N.S. = not significant. Scale bar is 50 μm.
|

Figure 2. osr1 is required to maintain and promote kidney development at the expense of hemangioblasts. (A) Although pax2a is restricted in 15 ss mutants, at 7 ss, ocn−/− embryos had a pax2a domain that appeared to occupy the same domain as WT siblings. Similarly, the hemangioblast marker tal1 appeared mostly WT in ocn−/− at 7 ss. Scale bar is 50 μm (B) FISH with probes for pax2a (green) and tal1 (red) and ICC using anti-caspase-3 (white) to mark apoptotic cells was conducted at 7 ss and 15 ss. The number of fragments in the combined pax2a and tal1 fields from somites 1–5 were increased in mutants at 7 ss but not at 15 ss. Scale bar is 35 μm (C–E) At 10 ss, little to no caspase-3 fragments were seen in pax2a or tal1 domains from somites 1–5, but a significant number were seen in osr1 morphants and ocn−/−. The tal1 domain was also expanded in both loss-of-function models. Scale bar is 35 μm. (F,G) ICC with the proliferative cell marker anti-pH3 was also conducted. Despite the expansion in tal1 in osr1-deficient models, there was no significant change in the number of proliferating cells. Scale bar is 10 μm. (H,I) FISH experiments were conducted to assess changes in apoptosis in wt1a+/pax2a+ podocyte progenitors. There was a significant increase in the number of apoptotic fragments within this field in mutants compared with WT siblings. Scale bar is 10 μm. A minimum of three individuals were assessed for each group across experiments. Photos are max intensity projections from z-stacks, and each side of mesoderm was quantified individually. p-values: ** p < 0.001, N.S. = not significant.
|
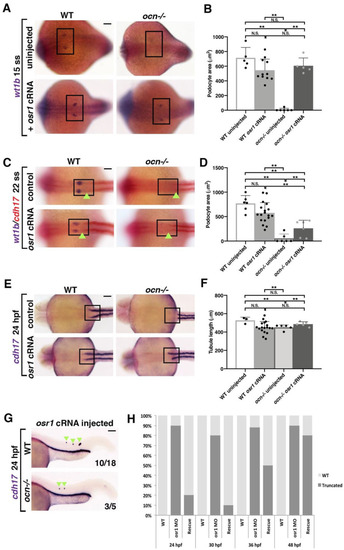
Figure 3. osr1 is required for the continued development of kidney lineages. (A,B) Embryos from ocn incrosses were injected at the 1-cell stage with 50 pgs of osr1 cRNA and examined. At 15 ss, podocytes (wt1b) were robustly rescued in ocn−/−. (C,D) However, by 22 ss, podocytes were only partially rescued in ocn−/− injected embryos, while tubule lengths in the same animals were not significantly different from WTs, as shown by the green arrowheads. (E–G) Truncated tubule was still able to be rescued in mutants at 24 hpf. Further, overexpression of osr1 induced ectopic tubule formation (green arrowheads). (H) A rescue time course was conducted with osr1 MO and osr1 cRNA to determine when the osr1 cRNA dosage became insufficient to rescue. While there was a 90% rescue rate at 24 hpf, by 48 hpf, this rate had dropped to 20%. This indicated that continued osr1 is needed for normal tubule development. p-values: ** p < 0.001, N.S. = not significant. For tubule rescue at 24 hpf, p-values were obtained from arcsin transformed kidney to body percentage calculations for each group. Scale bar is 50 μm for all images.
|
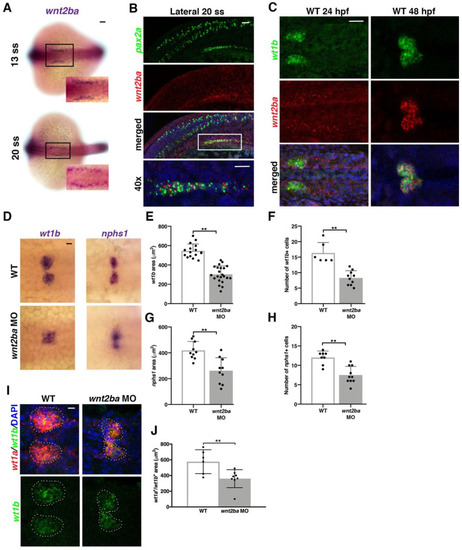
Figure 4. wnt2ba is a podocyte marker and regulator. (A) wnt2ba is expressed in bilateral stripes as early as 13 ss. Scale bar is 30 μm. (B) wnt2ba (red) is expressed within the anteriormost region of the IM, as shown by colocalization with pax2a (green). White box denotes area of colocalization, which is magnified in bottom panel. DAPI (blue) marks nuclei. Scale bar is 15 μm. (C) wnt2ba (red) also colocalized with the podocyte marker wt1b at 24 hpf, though at this time point it was also expressed in the putative neck segment domain. By 48 hpf, the wnt2ba domain was specified to the podocytes. Scale bar is 30 μm. (D–H) Podocyte area and cell number was assessed in wnt2ba morpholino-injected animals and determined to be reduced compared with WT controls. Both wt1b and nphs1 showed a significant decrease in domain area in wnt2ba morphants compared with WT embryos. (I,J) FISH with wt1a and wt1b was performed at 24 hpf. There was a significant area reduction in the podocyte domain seen in wnt2ba morphants compared to WTs. Scale bar is 10 μm. p-values: ** p < 0.001. Scale bar is 30 μm.
|

Figure 5. wnt2ba is sufficient for podocyte development downstream of osr1. (A) When wnt2ba was assessed at 15 ss, in ocn−/− and WT siblings, it was evident that staining was reduced in mutants. By 24 hpf, wnt2ba staining was almost completely absent, tracking with the loss of other podocyte markers in ocn−/−. Scale bar is 30 μm. (B) FISH experiments showed that osr1 and wnt2ba colocalized in cells at 22 ss. (C–H) Embryos were injected with osr1 MO and/or wnt2ba cRNA at the one-cell stage, and podocytes and the developing slit diaphragm were visualized at 24 hpf using wt1b and nphs1, respectively. Embryos injected with osr1 MO alone showed few podocyte or slit diaphragm cells, while embryos injected with wnt2ba cRNA alone had an increased podocyte area. Coinjected embryos had a partial rescue of podocytes, indicating that wnt2ba is a downstream factor in the podocyte pathway. A minimum of 5 individuals were imaged for quantification. p-values: ** p < 0.001, * p < 0.05, N.S. = not significant. Scale bar is 30 μm.
|
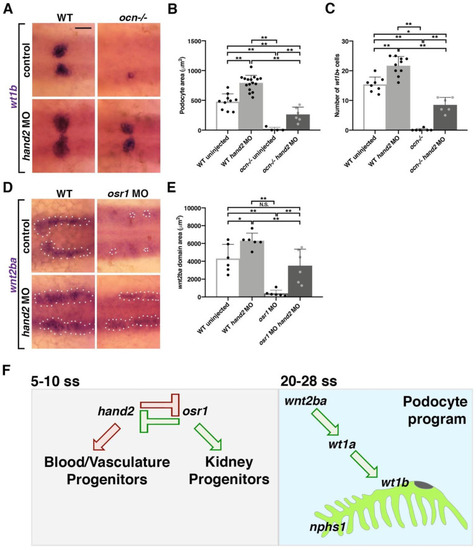
Figure 6. Acting in opposition to osr1, hand2 inhibits wnt2ba-driven podocyte development (A–C) Embryos from ocn incrosses were injected with hand2 MO. Podocyte area and cell number were partially rescued in ocn−/− injected embryos and were expanded in WT injected siblings. This signified that hand2 suppresses podocyte formation. (D,E) Similarly, wnt2ba expression was rescued in osr1/hand2 morphants compared with uninjected WT controls. Injection of hand2 MO alone led to a significant increase in the wnt2ba domain. All images were at 24 hpf, scale bar is 30 μm. A minimum of 5 individuals were imaged for quantification. p-values: ** p < 0.001, * p < 0.05, N.S. = not significant. (F) osr1 promotes podocyte and kidney lineages and suppress blood and vasculature, while hand2 acts in opposition. Imbalance of either of these factors leads to changes in mesodermal fates. Podocyte development is one example of a mesodermal fate that is altered by imbalance of osr1/hand2. This is because the downstream factor wnt2ba is decreased without osr1 yet increased in the absence of hand2. wnt2ba endorses the podocyte factor wt1a/b, which has been shown to be required for formation of podocytes and the slit diaphragm (nphs1).
|