
- Title
-
An ancestral mycobacterial effector promotes dissemination of infection
- Authors
- Saelens, J.W., Sweeney, M.I., Viswanathan, G., Xet-Mull, A.M., Jurcic Smith, K.L., Sisk, D.M., Hu, D.D., Cronin, R.M., Hughes, E.J., Brewer, W.J., Coers, J., Champion, M.M., Champion, P.A., Lowe, C.B., Smith, C.M., Lee, S., Stout, J.E., Tobin, D.M.
- Source
- Full text @ Cell
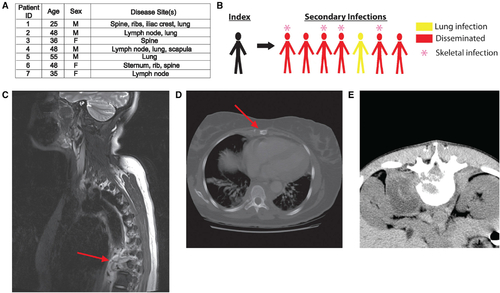
An outbreak in North Carolina with high rates of extrapulmonary and bone disease
(A) Characterization of all secondary cases of the NCG outbreak strain. All patients were HIV negative and had no known immunodeficiencies. (B) Schematic depicting index and secondary cases in the NCG outbreak. (C) Destructive lesion of T-spine vertebra 9 with extensive paraspinous abscess (red arrow) caused by Mtb NCG infection. (D) Lytic lesion of the sternum (red arrow) caused by Mtb NCG infection. (E) CT scan of paraspinous abscess caused by Mtb NCG infection. |

Identification of the NCG outbreak strain as a Lineage 1 strain
(A) Whole genome phylogenetic analysis based on reads from Comas et al.,6 identifying NCG as a member of the Manila clade of the Lineage 1 (L1) strains. Arrow denotes NCG. Gold star indicates emergence of shared C175T variant common to all L2, L3, and L4 strains. Scale bar indicates substitutions per variant as described in Saelens et al..54 (B) Amino acid alignment of EsxM for Mtb and other mycobacterial species, noting the early stop codon in modern strains predicted to truncate the protein and eliminate C-terminal secretion sequences (boxed area). (C) Quantitative RT-PCR analysis showing mean transcript levels of esxM and paralogs relative to sigA in WT M. marinum cultured in vitro and upon THP-1 infections (2 dpi) and in vivo larval zebrafish (4 dpi) infections. Log phase culture and phosphate starvation–error bars represent SD, data pooled from two independent experiments with three technical replicates for each. THP-1 and in vivo infection error bars represent SEM, data pooled from three independent experiments with three technical replicates. One-way ANOVA with Dunnett’s multiple comparisons test. (D) Mean transcript levels of esxM paralogs relative to esxM in Mtb NCG and H37Rv strains cultured in vitro in 7H9 media and upon mouse infection. Bacterial RNA isolated from C57BL/6J mouse lungs at 6 wpi after i.v. infection with Mtb NCG or H37Rv strains. Error bars represent SEM, three independent experiments with three technical replicates each. Statistical comparison by one sample t test. ****p < 0.0001. See also Figures S1 and S2 and Tables S1, S2, and S3. |

Dissemination in vivo is dependent on esxM
(A) A macrophage infected with WT M. marinum departs from an early granuloma and migrates above the midline (dashed white line). Scale bar, 50 μm. (B) Representative images from WT M. marinum, ΔesxM, and ΔesxM:esxM infections in larval zebrafish. 2 dpf zebrafish with red fluorescent macrophages are infected ventrally in the caudal vein with cerulean-expressing M. marinum. Scale bar, 500 μm. (C) At 5 dpi, ΔesxM demonstrates a reduced frequency in dissemination above the midline (white dashed line) to the dorsal side of the animal adjusting for burden across all three groups. One-way ANOVA with Tukey’s post-test, data from three biological replicates, mean ± SD shown. n > 35/experiment. (D) Co-infection with WT and ΔesxM M. marinum results in larval granulomas populated by both strains. Time-lapse imaging reveals WT M. marinum egressing from the granuloma (tracking lines), while ΔesxM remains confined within. White arrows indicate direction of egress. Scale bar, 50 μm. (E) Projection of time-lapse imaging in (D) showing complete range of movement for macrophages infected with each strain over 220 min; Scale bar 50 μm. (F) Quantification of rate of egress for WT and ΔesxM M. marinum from co-populated granulomas. Long-term monitoring of 4 mixed granulomas from 4 independent animals. Student’s paired t test, mean ± SD shown. (G) Migration of RAW 264.7 cells expressing fluorescent cerulean control or EsxM through transwell membranes in the presence and absence of chemokine. One-way ANOVA with Bonferonni’s post-test. *p < 0.05, **p < 0.01, ***p < 0.001. See also Figure S3, Table S4, and Videos S1 and S2. |

Macrophage-specific expression of ancestral full-length EsxM, but not its paralogs or modern, truncated EsxM, alters macrophage motility
(A) Transgene design (not to scale) for macrophage-specific expression of EsxM. The macrophage-specific zebrafish promoter mfap4 drives expression of the mycobacterial protein within zebrafish macrophages. 2A peptide uncouples EsxM protein (98 AA) from tdTomato. (B) Representative larval zebrafish expressing the mfap4:esxM-p2A-tdTomato transgene. Scale bar, 500 μm. (C) Increased macrophage motility in the absence of infection for EsxM-expressing transgenic zebrafish lines. Scale bar, 100 μm. (D) Migration and velocity measured in response to tail fin transection. One-way ANOVA, Dunn’s multiple comparison test. Data representative of three biological replicates. (E) Number of macrophages recruited to tail wound 90 min post-transection. Macrophages express fluorescent TdTomato, EsxM, or truncated EsxM (Q59X) via a macrophage-specific promoter (mfap4). One-way ANOVA with Dunn’s multiple comparison test. Data representative of three biological replicates. (F) Maximum velocity of macrophages migrating to tail wound. One-way ANOVA with Dunn’s multiple comparison test. Data representative of three biological replicates. Mean ± SD shown on all graphs. **p < 0.01, ***p < 0.001. See also Figure S3 and Video S3. |

Reintroduction of ancestral EsxM into modern Mtb reprograms macrophage motility through cytoskeletal alterations
(A) RAW264.7 cell migration during infection with Mtb strains mc26020 (Mtb6020 msp12:cerulean) or mc26020 constitutively expressing esxM (Mtb6020 hsp60p:esxM/msp12:cerulean) from an episomal plasmid across transwell membranes in the presence and absence of chemokine. Mean ± SD shown. One-way ANOVA with Bonferroni’s correction. (B) Quantitation of the presence of filopodia on BLaER1 cells infected with Mtb6020 msp12:cerulean or Mtb6020 hsp60p:esxM/msp12:cerulean. Two-tailed paired Student’s t test, mean ± SD shown. (C) Measured circularity of BLaER1 cells infected with Mtb6020 msp12:cerulean or Mtb6020 hsp60p:esxM/msp12:cerulean. (D) BLaER1 cells infected with Mtb6020 hsp60p∷esxM/msp12:cerulean demonstrate increased filopodia and reduced circularity compared to BLaER1 cells infected with Mtb6020 msp12∷cerulean. Bacteria in cyan and actin in red. Scale bar, 8 μm. (E) Electron micrographs of BLaER1 cells infected with Mtb6020 hsp60p∷esxM/msp12∷cerulean demonstrate increased filopodia compared to BLaER1 cells infected with Mtb6020 msp12∷cerulean. Scale bar, 2 μm. (F) BLaER1 cells infected with Mtb6020 msp12∷cerulean demonstrate peripheral localization of Arp2, compared to interior localization of Arp2 in cells infected with Mtb6020 hsp60p∷esxM/msp12∷cerulean. Insets display fluorescence intensity of Arp2 and actin along the green line, with interior localization in Mtb6020 hsp60p∷esxM/msp12∷cerulean infections. (G) Quantification of Arp2 localization from (F). Plot of the percentage of the area under the curve (AUC) for fluorescence in the Arp2 channel for the interval 0% to 25% of the normalized distance across the longest cell axis normalized to AUC from the middle 50% (25%–75%) of the total cell length. Each data point represents a single cell. Statistics from Student’s t test. Scale bar, 8 μm. *p < 0.05, **p < 0.01, ***p < 0.001. All images are representative of at least two biologically independent experiments. See also Figure S4. |
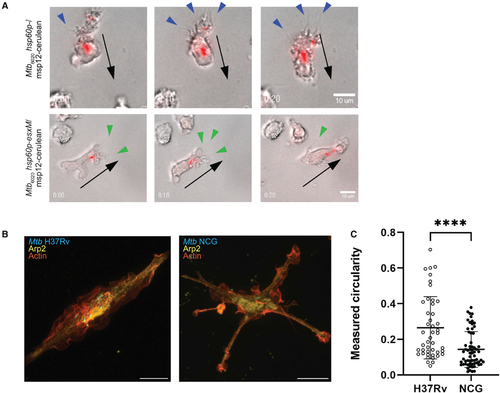
Altered macrophage motility and morphology during M. tuberculosis infection with full-length EsxM variants
(A) Time-lapse imaging of BLaER1 cells infected with Mtb6020 msp12∷cerulean or Mtb6020 hsp60p∷esxM/msp12∷cerulean. Bacteria false-colored red. Spiky projections, likely retraction fibers, (blue arrowheads) localize to the lagging edge in BLaER1 cells infected with Mtb6020 msp12∷cerulean. Filopodial projections (green arrowheads) localize to the leading edge in BLaER1 cells infected with Mtb6020 hsp60p∷esxM/msp12∷cerulean. Black arrows indicate the direction of cell migration. (B and C) Infection of BLaER1 cells with Lineage 4 (L4) Mtb H37Rv results in infected cells with membrane ruffles. Infection with the Lineage 1 (L1) Mtb NCG outbreak strain results in an increase in spiky projections and (C) a decrease in circularity, two-tailed paired Student’s t test, mean ± SD shown. ****p < 0.0001. All images representative from at least two biologically independent experiments. See also Figures S4 and S5 and Video S4. |

Ancestral esxM promotes spinal dissemination
(A) Representative image of sham-injected osteoblast line 3 weeks post-injection. Intervertebral spacing is tightly delineated (white arrowhead), and osteoblast signal at hemal arches is typical of healthy zebrafish (black arrowhead). Scale bar, 500 μm. (B) Representative image of cerulean M. marinum-infected osteoblast line, three weeks post-infection (wpi) showing bone-associated infection. Scale bar, 100 μm. (B′) Same animal as in (B), showing only osteoblasts. M. marinum has invaded into the intervertebral space, giving rise to a vertebral lesion (red arrowhead) and proliferation of osteoblasts proximal to infection (yellow arrowhead). Scale bar, 100 μm. (C) Dual transgenic line at 35 dpf labeling osteoblasts in purple from the Sp7/osterix promoter and osteoclasts from the acp5a/TRAP promoter in yellow. Scale bar, 500 μm. (C1-C3) Insets show tight association of osteoblasts and osteoclasts along the spine (C3). Yellow multinucleate osteoclasts are also visible in the head (C1 and C2). C1 inset scale bar, 500 μm C2 inset scale bar, 50 μ. C3 inset scale bar, 100 μm. (D) Intraperitoneal infection of juvenile animals with cerulean-fluorescent M. marinum results in frequent dissemination to spine (approximately 70% of animals). Scale bar, 500 μm. (D1) High magnification view of boxed area of (D) showing association of granuloma with spine and alterations in normal osteoclast distribution. Scale bar, 100 μm. (E) PACT-based clearing techniques in adults and juveniles enable high-resolution imaging of sites of bone disease. Confocal image of dorsal region of spine showing unaffected vertebrae with typical osteoclast behavior (dark blue arrowheads) and altered osteoclast behavior (orange arrowheads) in segments associated with granulomas (bacteria in cyan). Scale bar, 100 μm. (F) Quantitation of dissemination to spine at 14 dpi in intraperitoneal infections. n ≥ 7 per group for 3 biological replicates. One-way ANOVA with Tukey’s post-test, data from three biological replicates, mean ± SD shown. ***p < 0.001. |
Reprinted from Cell, 185(24), Saelens, J.W., Sweeney, M.I., Viswanathan, G., Xet-Mull, A.M., Jurcic Smith, K.L., Sisk, D.M., Hu, D.D., Cronin, R.M., Hughes, E.J., Brewer, W.J., Coers, J., Champion, M.M., Champion, P.A., Lowe, C.B., Smith, C.M., Lee, S., Stout, J.E., Tobin, D.M., An ancestral mycobacterial effector promotes dissemination of infection, 4507-4525.e18, Copyright (2022) with permission from Elsevier. Full text @ Cell