
- Title
-
Intermediate cells of in vitro cellular reprogramming and in vivo tissue regeneration require desmoplakin
- Authors
- Ha, J., Kim, B.S., Min, B., Nam, J., Lee, J.G., Lee, M., Yoon, B.H., Choi, Y.H., Im, I., Park, J.S., Choi, H., Baek, A., Cho, S.M., Lee, M.O., Nam, K.H., Mun, J.Y., Kim, M., Kim, S.Y., Son, M.Y., Kang, Y.K., Lee, J.S., Kim, J.K., Kim, J.
- Source
- Full text @ Sci Adv
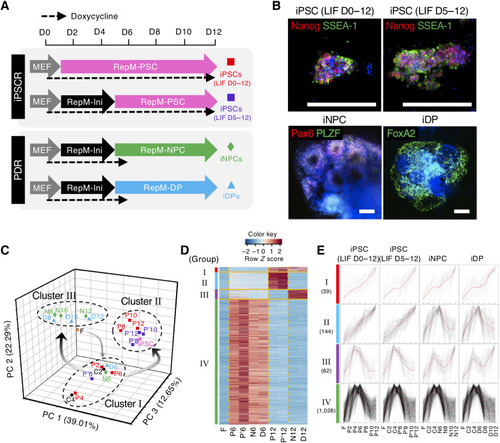
Substantial changes in gene expression occur immediately after day 6.
(A) Schematic of the four reprogramming regimes from 2° MEFs to iPSCs using two different protocols (top), or via PDR to iNPCs or iDPs (bottom). D, day; MEF, medium for mouse embryonic fibroblast (MEF); RepM-Ini, reprogramming initiation medium; RepM-PSC, reprogramming medium for pluripotent stem cell (PSC); RepM-NPC, reprogramming medium for neural stem/progenitor cell (NPC); RepM-DP, reprogramming medium for dopaminergic neuronal progenitor (DP). (B) Immunostaining images of cells from the four reprogramming regimes as in (A) on day 12 with markers for iPSC (Nanog and SSEA-1), iNPC (Pax6 and PLZF), or iDP (FoxA2). Scale bars, 200 μm. (C) Principal components analyses (PCA) of the microarray datasets. Each reprogramming sample is colored by the reprogramming regime. The numbers indicate the days after reprogramming when RNA was collected. F, 2° MEFs; C, common intermediates without LIF; P, iPSC reprogramming (LIF D0 to D12); P′, iPSCR (LIF D5 to D12); N, iNPC reprogramming; D, iDP reprogramming. (D) Heatmap showing gene expression of four groups in 2° MEFs (F), at day 6 samples (P6, P′6, N6, and D6), and day 12 samples (P12, P′12, N12, and D12). (E) The individual expression patterns of the four groups are superimposed. The number of genes in each group is presented. All values were normalized to the average expression of each gene and visualized by a line plot. Red line represents mean of gene expression. |

Desmosomes are formed only in the intermediate phase of reprogramming.
(A) Network-based analysis of GO terms under the classifications biological process, cellular component, immune system, and molecular function in the 244 common genes visualized by ClueGO. Major GO terms are represented at the node (P < 0.08). The linked lines between nodes were created on the basis of a predefined κ score level (>0.4). The node size represents the P value (P < 0.001; 0.001 < P < 0.05; 0.05 < P < 0.1). (B) Gene set enrichment analysis (GSEA) showing that “desmosome” and “epidermal cell differentiation” represent the highest normalized enrichment score (NES). GSEA was performed using transcriptomes of ICs (day 6 samples in 2° MEF and 4F2A MEF reprogramming) versus transcriptomes of starting cells (2° MEFs and 4F2A MEFs) and end-point cells (P12, P′12, N12, and D12 of 2° MEFs, iPSCs, and iNPCs of 4F2A MEFs). NESs and P values are shown. (C) Heatmap showing the expression of indicated genes, including epithelial and mesenchymal markers. (D) Representative TEM images of cellular junction regions in 2° MEFs, day 6 samples of iPSCR and iNPCR, iPSCs, and iNPCs. White arrows indicate mature desmosome. Scale bar, 0.5 μm. Data are representative of experimental duplicates. |

Suppression of Dsp impedes OSKM-mediated reprogramming by controlling IC formation.
(A) Western blot for Dsp and Rpl7 during iPSCR and PDR of shDsp–green fluorescent protein (GFP)–positive sorted 2° MEFs. The bar graph indicates the quantitative expression of Dsp. Samples were harvested at day 6 in both iPSCR and iNPC. Four independent experiments were performed and Rpl7 was used as the loading control (n = 2 wells, P < 0.0001). D.W., distilled water; IPTG, isopropyl β-d-1-thiogalactopyranoside. (B and C) Whole-well imaging of alkaline phosphatase (AP) staining and quantitative analysis of the AP+ colonies (B) and Nanog+ colonies (C) at day 12 of iPSCR with D.W. or IPTG (B, n = 2 wells, P = 0.0112; C, n = 2 wells, P = 0.0056). (D) Quantitative analysis of Pax6+ colonies at day 12 of iNPCR with D.W. or IPTG (n = 2 wells; P = 0.0202). (E and F) Representative phase-contrast images and quantitative analysis of cell aggregates on day 6 of iPSCR (E) and iNPCR (F) with D.W. or IPTG. Scale bars, 200 μm [E, n = 2 wells; shDsp (−), P = 0.80; shDsp (+), P = 0.0047] [F, n = 2 wells; shDsp (−), P = 0.34; shDsp (+), P = 0.0015]. Error bars represent ± SEM (A) or ± SD (B to F). P values <0.05 were considered significant (*P < 0.05 and **P < 0.01), two-tailed, paired Student’s t test was used. Data are representative of two independent experiments. |
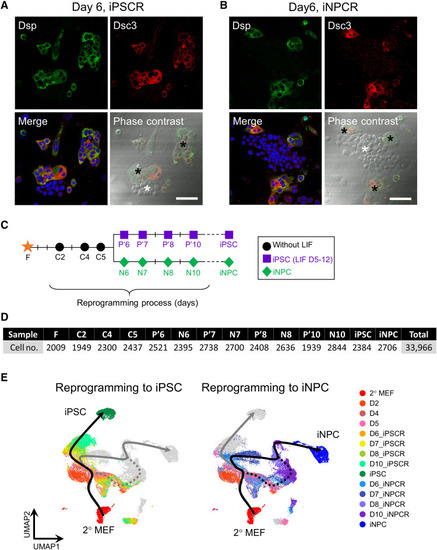
There are two types of ICs, depending on Dsp expression.
(A and B) Immunostaining and phase-contrast images with desmosomal components (Dsp and Dsc3) on day 6 of iPSCR (A) and iNPCR (B) under normal conditions. The black asterisk indicates positive cells and the white asterisk indicates negative cells of the indicated desmosomal components in one colony. Scale bars, 50 μm. (C) Schematic of two reprogramming regimes and sample collection for scRNA-seq. (D) The number of single-cell libraries at each reprogramming day. (E) UMAP plots of cells during iPSC or iNPC reprogramming colored by collection time points with bifurcating reprogramming trajectories inferred by Slingshot. The dotted line reveals the failed path of iNPC reprogramming. |

gICs are derived from dICs.
(A) UMAP plots of scRNA-seq data showing cells between days 5 and 7 of iPSCR and iNPCR. (B and C) Signature score distribution for indicated genes (B) and identity gene sets (C) defining dICs and gICs on the UMAP. Scale bars represent the minimum (Min) and maximum (Max) signature scores during the whole reprogramming process. (D) Reverse-transcription quantitative PCR for indicated genes. 2° MEFs were used as a negative control (gray) and iPSCs were used as a positive control for the pluripotency marker (red). Day 6 samples included whole cells of day 6 and gICs were isolated on day 6 of iPSCR (black) and iNPCR (white). (E) Phase-contrast and immunostaining images of the same region of interest after re-attachment of gICs from day 6 of iPSCR or iNPCR (D0). Immunostaining was performed for Nanog on day 6 after reattachment (D+6). Scale bars, 100 μm. (F) Predicted reprogramming trajectories inferred by Slingshot showing the dICs branching to Shisa8-positive and Shisa8-negative paths. Cells are colored by clusters. Error bars represent ± SE. Data are representative of experimental triplicates. (G and H) UMAP plots of cells between days 5 and 7, highlighting the descendants of clusters 1 and 8 during iPSCR (E) and iNPCR (F). Color and intensity represent collection time point and descendant probability estimated by WOT. |

The expression of pluripotency markers during OSKM-mediated reprogramming.
(A) UMAP plots of cells during iPSC or iNPC reprogramming showing the expression of pluripotency marker genes. (B) Heatmaps showing the expression of the pluripotency marker gene signatures in cells from iPSCR and iNPCR. Reprogramming day is indicated by colors in the upper bar. |

Loss of dsp impedes in vivo regeneration by controlling blastemal cell induction.
(A) Phase-contrast images of larvae fin folds after amputation. Fin fold amputation was done at 2 dpf and photographed 24 hours later. The graph shows the percentage of 1-dpa versus 0-dpa fin fold outgrowth (in gray) and average inhibition of 1-dpa versus 0-dpa fin fold (in red). Scale bar, 100 μm (n = 60, 56 embryos, P < 0.0001). dpa, days postamputation; ctrl, control; MO, morpholino; dsp mix MO, dspa MO + dspb MO. (B) Whole-mount in situ hybridization (WISH) analysis of larvae fin folds with control MO or dsp mix MO. Representative phase-contrast images and quantitative analysis show the expression of blastema marker gene (junbb) in regenerating fin folds. Uncut controls were equivalently stained. Dotted lines indicate the boundary of the fin folds. Scale bar, 100 μm (n = 40, 48 embryos, P < 0.0001). hdf, hours postfertilization; hpa, hours postamputation. (C) Phase-contrast and fluorescence merged images of adult fins after injection and electroporation with ctrl MO, pou5f3 MO (positive control), and dsp mix MO. Injection was done into the dorsal half of a 2-dpa blastema and photographed 24 hours later. The graph shows the percentage of dorsal versus ventral fin outgrowth (in gray) and average inhibition of dorsal versus ventral fin (in red). The line on each image denotes the fins at 2 dpa. Scale bar, 500 μm (n = 7 fishes, P < 0.0001). Error bars represent ± SD. P values <0.05 were considered significant (***P < 0.001), and two-tailed, paired Student’s t test was used. Data are representative of two independent experiments. See Materials and Methods for exact calculation. |

ZFIN is incorporating published figure images and captions as part of an ongoing project. Figures from some publications have not yet been curated, or are not available for display because of copyright restrictions. PHENOTYPE:
|