
|
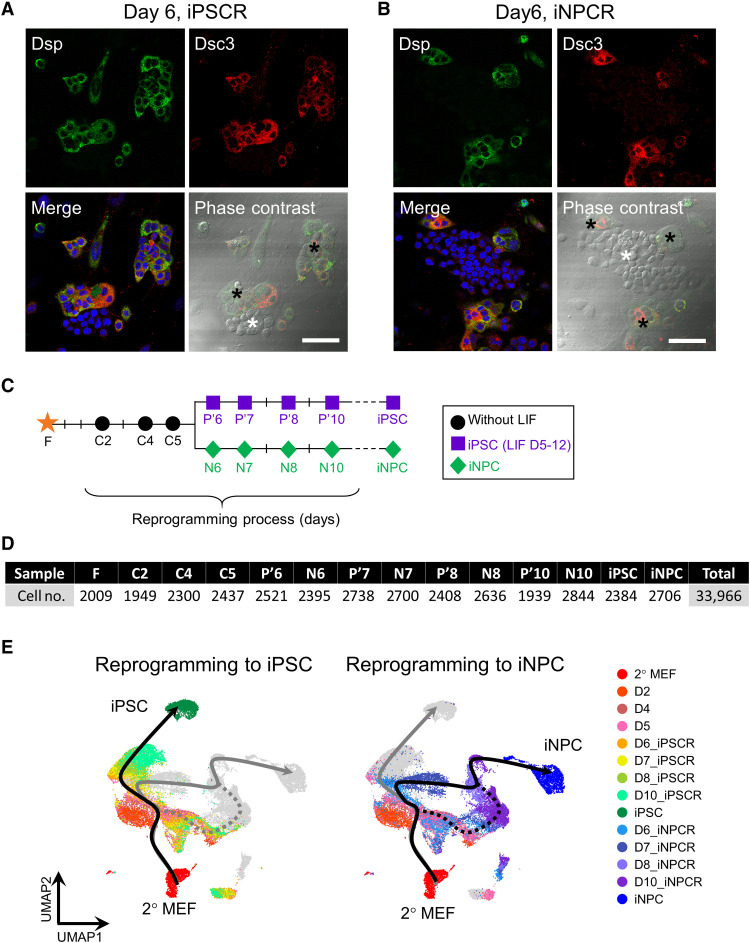
Fig. 4
(A and B) Immunostaining and phase-contrast images with desmosomal components (Dsp and Dsc3) on day 6 of iPSCR (A) and iNPCR (B) under normal conditions. The black asterisk indicates positive cells and the white asterisk indicates negative cells of the indicated desmosomal components in one colony. Scale bars, 50 μm. (C) Schematic of two reprogramming regimes and sample collection for scRNA-seq. (D) The number of single-cell libraries at each reprogramming day. (E) UMAP plots of cells during iPSC or iNPC reprogramming colored by collection time points with bifurcating reprogramming trajectories inferred by Slingshot. The dotted line reveals the failed path of iNPC reprogramming.