
- Title
-
Discovery of anti-stroke active substances in Guhong injection based on multi-phenotypic screening of zebrafish
- Authors
- Wang, Y., Wu, H., Sheng, H., Wang, Y., Li, X., Wang, Y., Zhao, L.
- Source
- Full text @ Biomed. Pharmacother.
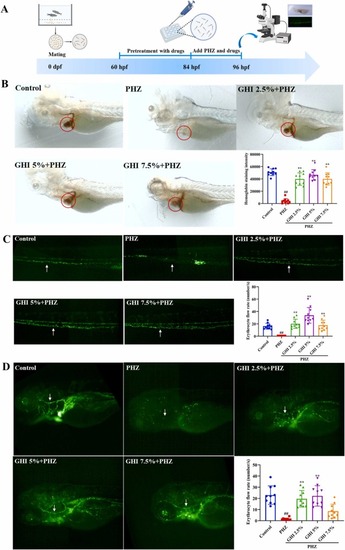
Fig. 1. GHI showed anti-thrombotic effects in PHZ-induced zebrafish thrombosis model. (A) Schematic diagram of experimental design. (B) Representative images of o-dianisidine staining at the heart region (circled by red line) and the quantification of staining intensity of erythrocytes in the heart (n = 10). (C) Representative images of blood flow of caudal vein in Tg (LCR:eGFP) zebrafish embryos and the quantitative analysis of erythrocyte flow rate (n = 10). (D) Representative images of blood flow of brain primary cephalic sinus in Tg (LCR:eGFP) zebrafish embryos and corresponding quantitative results (n = 10). Areas for blood flow quantification were indicated by white arrows. Data are presented as the mean ± SD. #p < 0.05, and ##p < 0.01 versus the control group; *p < 0.05, and **p < 0.01 versus the PHZ group. PHZ, phenylhydrazine; GHI, Guhong injection. |
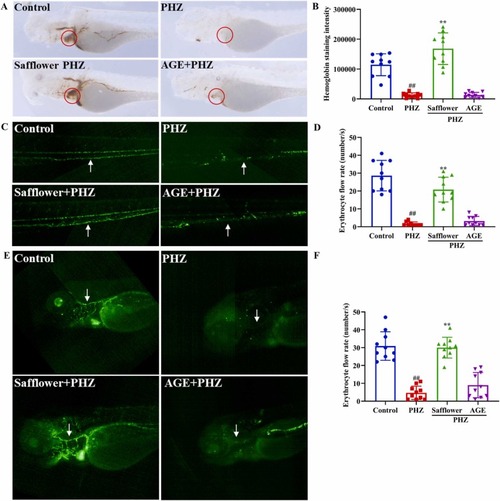
Fig. 2. Safflower extract prevented thrombus formation in PHZ-induced zebrafish thrombosis model. (A-B) Representative images (A) and quantitative analysis (B) of hemoglobin staining of heart (circled by red line). (C-D) Representative images (C) and quantitative analysis (D) of the erythrocyte flow rate of caudal vein in Tg (LCR:eGFP) thrombosis model (n = 10). (E-F) Representative images (E) and quantitative analysis (F) of cerebral blood flow in Tg (LCR:eGFP) thrombosis model (n = 10). Areas for blood flow quantification were indicated by white arrows. Data are displayed as the mean ± SD. #p < 0.05, and ##p < 0.01 versus the control group; *p < 0.05, and **p <0.01 versus the PHZ group. PHZ, phenylhydrazine; AGE, aceglutamide. |
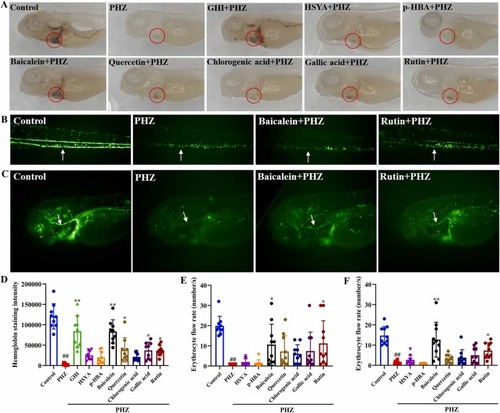
Fig. 3. Screening for active substances of GHI in PHZ-induced zebrafish thrombosis model. (A) Representative images of active compounds screening based on the hemoglobin levels in the heart of zebrafish embryos (circled by red line). (B-C) Representative images of the regulatory effects of baicalein and rutin on the peripheral (B) and cerebral blood flow (C). (D-F) Quantification of hemoglobin staining (D, n = 9), caudal vein blood flow (E, n = 10), and brain primary cephalic sinus blood flow (F, n = 10). Areas for blood flow quantification were indicated by white arrows. Data are shown as the mean ± SD. #p < 0.05, and ##p < 0.01 versus the control group; *p < 0.05, and **p <0.01 versus the PHZ group. PHZ, phenylhydrazine; GHI, Guhong injection; HSYA, hydroxysafflor yellow A; p-HBA, p-hydroxy benzaldehyde. |
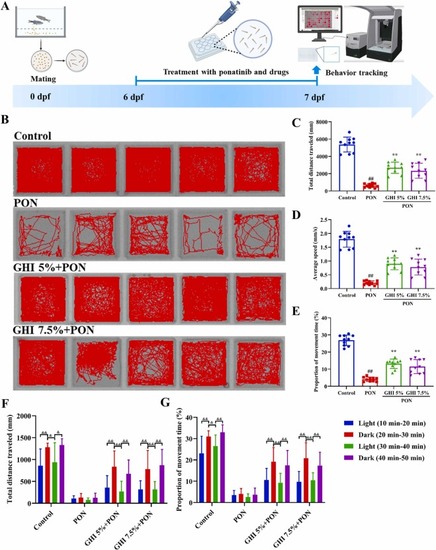
Fig. 4. GHI prevented the motor impairment in a zebrafish ischemic stroke model. (A) Schematic diagram of experimental design. (B) Representative images of motion tracking. (C-E) Bar graph representing the quantitative results of total movement distance (C), average speed of swimming (D), and proportion of movement time (E). (F-G) Quantification of total movement distance (F) and proportion of movement time (G) of zebrafish in response to light-to-dark photoperiod stimulation. N = 10 for each group. Data are displayed as the mean ± SD. #p < 0.05, and ##p < 0.01 versus the control group; *p < 0.05, and **p < 0.01 versus the PON group. &p < 0.05, and &&p < 0.01 versus darkness. PON, ponatinib; GHI, Guhong injection. |
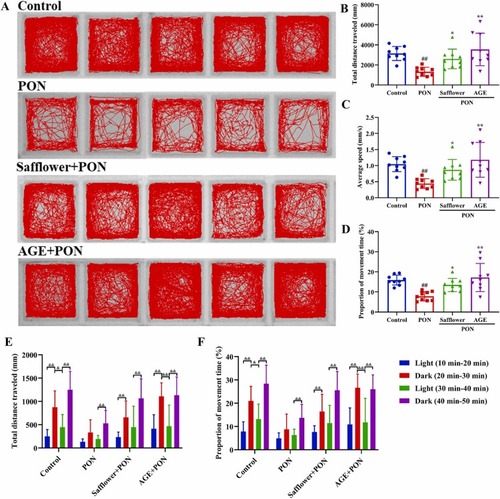
Fig. 5. Both safflower extract and AGE rescued the abnormal locomotor behaviors in a zebrafish ischemic stroke model. (A) Representative images of motion tracking of different groups. (B-D) Quantification of total swimming distance (B), average speed of swimming (C), and proportion of movement time (D). (E-F) Bar graph representing the quantitative results of total swimming distance (E) and proportion of movement time (F) of zebrafish in response to light-to-dark photoperiod stimulation. N = 9 for each group. Data are shown as the mean ± SD. #p < 0.05, and ##p < 0.01 versus the control group; *p < 0.05, and **p < 0.01 versus the PON group. &p < 0.05, and &&p < 0.01 versus darkness. PON, ponatinib; AGE, aceglutamide. |
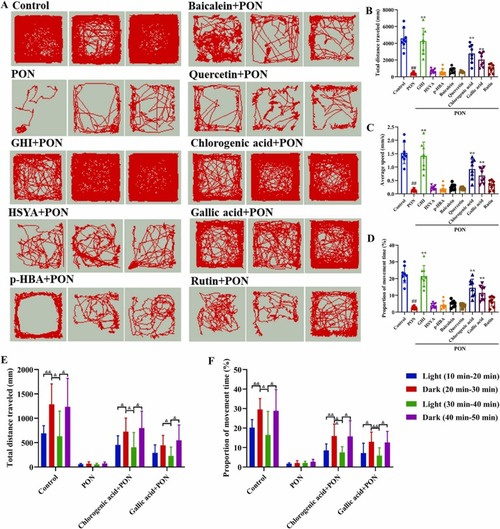
Fig. 6. Screening of active compounds of GHI in PON-stimulated zebrafish ischemic stroke model. (A) Representative images of motion tracking of the main chemical components in GHI. (B-D) Quantitative analysis of total movement distance (B), average speed (C), and proportion of movement time (D). (E) Quantitative results of total movement distance (E) and proportion of swimming time (F) of zebrafish in response to light-to-dark photoperiod stimulation. N = 8 for each group. Data are presented as the mean ± SD. #p < 0.05, and ##p < 0.01 versus the control group; *p < 0.05, and **p < 0.01 versus the PON group. &p < 0.05, and &&p < 0.01 versus darkness. PON, ponatinib; GHI, Guhong injection; HSYA, hydroxysafflor yellow A; p-HBA, p-hydroxy benzaldehyde. |
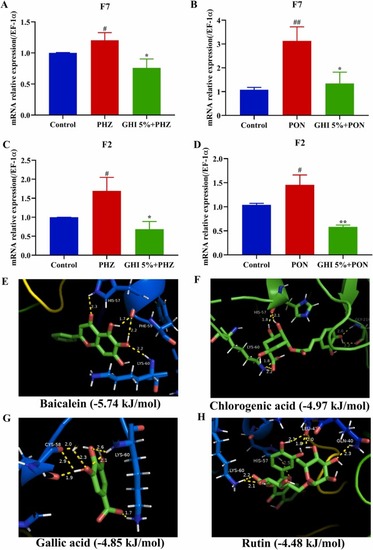
Fig. 7. RT-qPCR combined with molecular docking revealing anti-coagulant actions of GHI and its active compounds targeting coagulation factors. (A-D) The relative mRNA expression levels of F7 (A, B) and F2 (C, D) in PHZ-stimulated (A, C) and PON-stimualted (B, D) zebrafish embryos. (I-L) Molecular docking results of baicalein (E), chlorogenic acid (F), gallic acid (G), and rutin (H) targeting F7. Data are shown as the mean ± SD. #p < 0.05, and ##p < 0.01 versus the control group; *p < 0.05, and **p < 0.01 versus the PHZ group or PON group. PHZ, phenylhydrazine; PON, ponatinib; GHI, Guhong injection. |
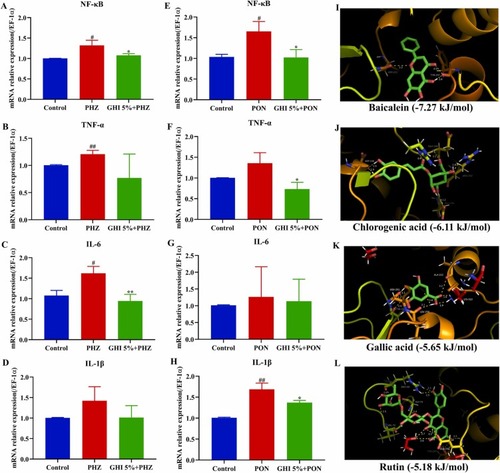
Fig. 8. RT-qPCR combined with molecular docking revealing anti-inflammatory effects of GHI and its active compounds targeting NF-κB pathway. (A-H) The relative mRNA expression levels of NF-κB (A, E), TNF-α (B, F), IL-6 (C, G), and IL-1β (D, H) in PHZ-stimulated (A-D) and PON-stimualted (E-H) zebrafish embryos. (I-L) Molecular docking results of baicalein (I), chlorogenic acid (J), gallic acid (K), and rutin (L) targeting NF-κB p65. Data are shown as the mean ± SD. #p < 0.05, and ##p < 0.01 versus the control group; *p < 0.05, and **p < 0.01 versus the PHZ group or PON group. PHZ, phenylhydrazine; PON, ponatinib; GHI, Guhong injection. |