
|
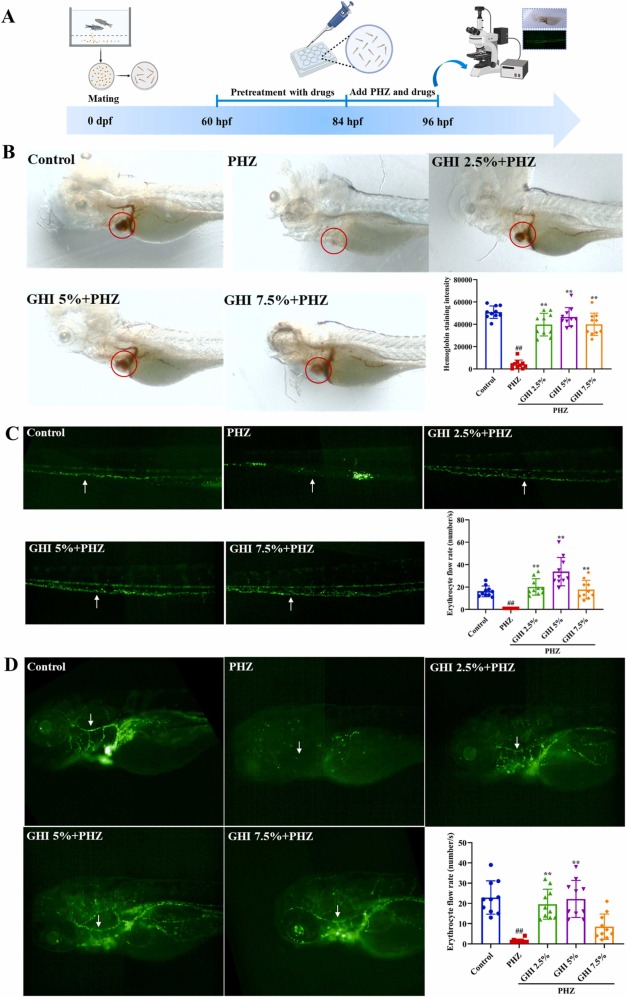
Fig. 1
Fig. 1. GHI showed anti-thrombotic effects in PHZ-induced zebrafish thrombosis model. (A) Schematic diagram of experimental design. (B) Representative images of o-dianisidine staining at the heart region (circled by red line) and the quantification of staining intensity of erythrocytes in the heart (n = 10). (C) Representative images of blood flow of caudal vein in Tg (LCR:eGFP) zebrafish embryos and the quantitative analysis of erythrocyte flow rate (n = 10). (D) Representative images of blood flow of brain primary cephalic sinus in Tg (LCR:eGFP) zebrafish embryos and corresponding quantitative results (n = 10). Areas for blood flow quantification were indicated by white arrows. Data are presented as the mean ± SD. #p < 0.05, and ##p < 0.01 versus the control group; *p < 0.05, and **p < 0.01 versus the PHZ group. PHZ, phenylhydrazine; GHI, Guhong injection.