
- Title
-
Alone in a crowd: effect of a nonfunctional lateral line on expression of the social hormone parathyroid hormone 2
- Authors
- Venuto, A., Smith, C.P., Cameron-Pack, M., Erickson, T.
- Source
- Full text @ Biol. Open
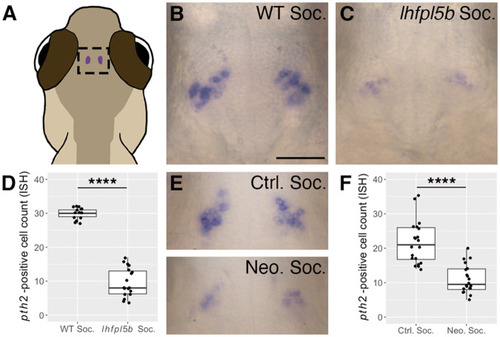
Decreased pth2 expression in lateral line-deficient zebrafish larvae. (A) Location of pth2-expressing cells in the thalamic region of a larval zebrafish. (B,C) Representative images of mRNA ISH showing pth2-positive cells in socially reared (B) WT and (C) lateral line mutant (lhfpl5bvo35) larvae at 4 dpf. (D) Boxplots of pth2-positive cell counts from ISH images of lhfpl5b larvae at 4 dpf (WT social=14, lhfpl5b social=18 larvae from two replicates). (E) Representative mRNA ISH images from socially reared control (ctrl soc) and neomycin-treated (neo soc) larvae at 4 dpf showing reduced pth2 expression following repeated chemical ablation of the lateral line hair cells. (F) Boxplots of pth2-positive cell counts from control and neomycin-treated larvae at 4 dpf (ctrl soc=20; neo soc=20 larvae pooled from two replicates). Scale bar in B: 50 µm, applies to all images. A one-tailed Welch's t-test was used to assess significance, ****P<0.0001. |
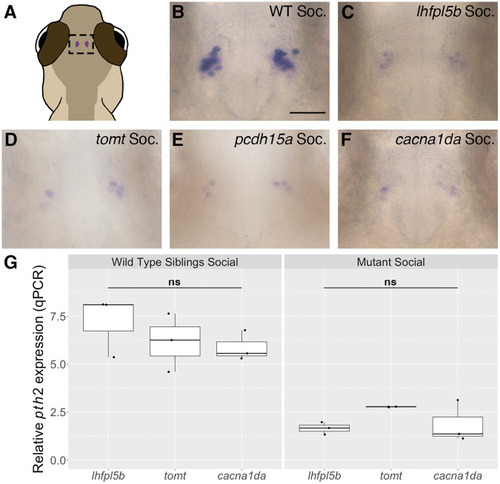
Lack of evidence for modulation of pth2 expression by mechanosensory inputs from inner ear hair cells. (A) Location of pth2-expressing cells in the thalamic region of a larval zebrafish. (B-F) Representative images of mRNA ISH showing pth2-positive cells in socially reared larvae at 4 dpf: (B) WT (n=14); (C) lhfpl5bvo35 (n=18); (D) tomttk256c (n=13); (E) pcdh15ath263b (n=13), and (F) cacna1datc323d (n=18). Scale bar: 50 µm, applies to all images. (G) Boxplots of qPCR results showing pth2 expression in socially reared mutants and siblings at 4 dpf. Ten larval heads were pooled per condition to make one biological replicate, and three biological replicates were used to generate the data. Two technical replicates of the qPCR experiment were conducted per biological replicate and averaged. One-way ANOVA to assess significance; ns, not significant. |

Social isolation further reduces pth2 expression in sensory-hair-cell mutants. (A-C) mRNA ISH showing representative examples of pth2-positive cells in 4 dpf (A) socially-reared lhfpl5bvo35 mutants (n=48), (B) isolated WT larvae (n=50), and (C) isolated lhfpl5bvo35 mutants (n=40). Scale bar: 50 µm, applies to all images. (D) Boxplots of qPCR results comparing pth2 expression in socially reared lhfpl5bvo35 and tomttk256c mutants relative to isolated mutant and WT siblings at 4 dpf. Ten larval heads were pooled per condition to make one biological replicate, and three biological replicates were used to generate the data. Two technical replicates of the qPCR experiment were conducted per biological replicate and averaged. Two-way ANOVA with Tukey post-hoc test to assess significance, ***P<0.001, *P<0.05; ns, not significant. |
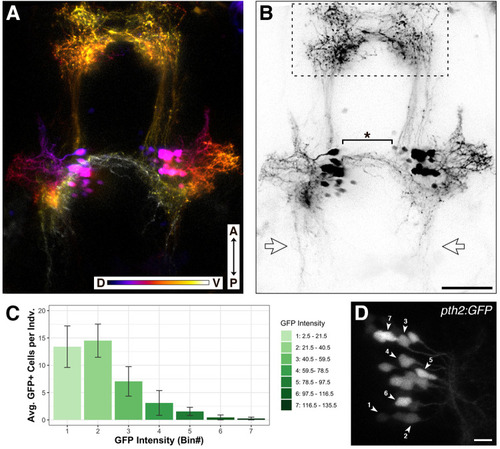
Morphology of pth2-expressing cells using fluorescent reporters. (A) Depth-encoded representation of the Tg(pth2:TagRFP)unb3 transgenic line at 5 dpf. The anterior–posterior (A–P) axis and dorsal–ventral (D–V) depth color scales are indicated at the bottom. Image depth is 152 µm. (B) Black and white version of the image in A. The dashed line box indicates the anterior neuropil, the starred bracket highlights the ventral neurites that cross the midline, and the bilateral open arrows point to posterior neurites. Scale bar in B: 50 µm, applies to both images. See Movie 1 for a 3D rendering of the depth-encoded pth2 transgene. (C) Bar graph showing binned fluorescent intensity of GFP-positive cells (n=20 larvae from two different clutches at 4 dpf). (D) Zoomed-in image of one GFP-positive cell cluster exhibiting the full range of cell fluorescent intensity, labelled according to bins outlined in the associated bar graph. Image depth is 32 µm. Scale bar: 10 µm. |

The pth2 transgenes respond to social context and lateral line input. (A,B) Representative images of Tg(pth2:TagRFP)unb3 (false-colored green) and Tg(slc6a3:EGFP)ot80 (false-colored magenta) transgenes in (A) socially reared and (B) isolated larvae at 4 dpf. Merges of the two channels show the close proximity of the pth2 and slc6a3-positive cell clusters. (C) Boxplots of pth2 and slc6a3 cell counts (n=15 per condition). (D,E) Representative images of Tg(pth2:EGFP)unb2 transgene expression in socially reared (D) WT and (E) lateral line mutant (lhfpl5bvo35) larvae at 4 dpf. (F) Boxplots of GFP-positive cell counts in WT and lhfpl5b mutant siblings (n=12 per condition). Scale bars: 50 µm. For both experiments, a one-tailed Welch's t-test was used to assess significance, ****P<0.0001; ns, not significant. |