
Fig. 4.
- ID
- ZDB-FIG-221029-4
- Publication
- Venuto et al., 2022 - Alone in a crowd: effect of a nonfunctional lateral line on expression of the social hormone parathyroid hormone 2
- Other Figures
- All Figure Page
- Back to All Figure Page
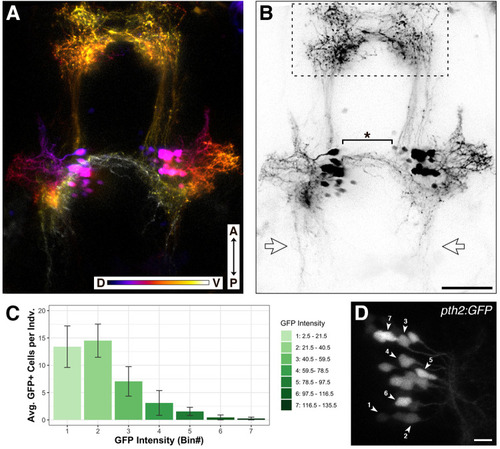
Morphology of pth2-expressing cells using fluorescent reporters. (A) Depth-encoded representation of the Tg(pth2:TagRFP)unb3 transgenic line at 5 dpf. The anterior–posterior (A–P) axis and dorsal–ventral (D–V) depth color scales are indicated at the bottom. Image depth is 152 µm. (B) Black and white version of the image in A. The dashed line box indicates the anterior neuropil, the starred bracket highlights the ventral neurites that cross the midline, and the bilateral open arrows point to posterior neurites. Scale bar in B: 50 µm, applies to both images. See Movie 1 for a 3D rendering of the depth-encoded pth2 transgene. (C) Bar graph showing binned fluorescent intensity of GFP-positive cells (n=20 larvae from two different clutches at 4 dpf). (D) Zoomed-in image of one GFP-positive cell cluster exhibiting the full range of cell fluorescent intensity, labelled according to bins outlined in the associated bar graph. Image depth is 32 µm. Scale bar: 10 µm. |