
|
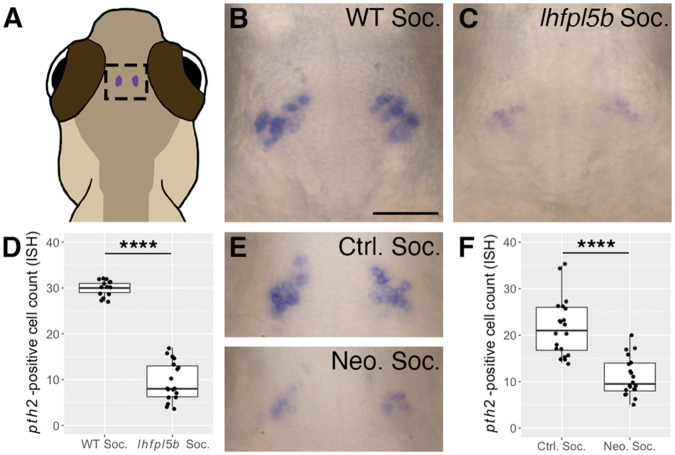
Fig. 1.
Decreased pth2 expression in lateral line-deficient zebrafish larvae. (A) Location of pth2-expressing cells in the thalamic region of a larval zebrafish. (B,C) Representative images of mRNA ISH showing pth2-positive cells in socially reared (B) WT and (C) lateral line mutant (lhfpl5bvo35) larvae at 4 dpf. (D) Boxplots of pth2-positive cell counts from ISH images of lhfpl5b larvae at 4 dpf (WT social=14, lhfpl5b social=18 larvae from two replicates). (E) Representative mRNA ISH images from socially reared control (ctrl soc) and neomycin-treated (neo soc) larvae at 4 dpf showing reduced pth2 expression following repeated chemical ablation of the lateral line hair cells. (F) Boxplots of pth2-positive cell counts from control and neomycin-treated larvae at 4 dpf (ctrl soc=20; neo soc=20 larvae pooled from two replicates). Scale bar in B: 50 µm, applies to all images. A one-tailed Welch's t-test was used to assess significance, ****P<0.0001.