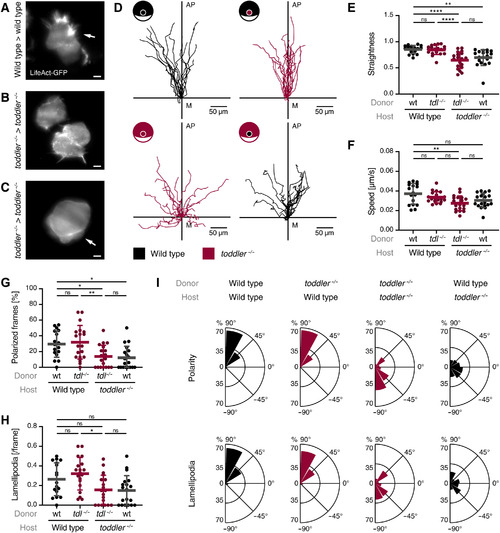
Fig. 1. Toddler acts cell non-autonomously to mediate animal pole–directed polarization and migration of mesendodermal progenitors.
LifeAct-GFP–labeled reporter cells (maximum 10 cells) were transplanted from the margin of a wild-type or toddler−/− donor embryo to the margin of a host embryo of the same or opposite genotype. (A to C) Representative light sheet microscopy images of internalized wild-type (A) or toddler−/− (B and C) reporter cells in a genotype-matched host embryo. White arrows indicate lamellipodia (A) and blebs (C). Scale bars, 10 μm. (D) Migration tracks of transplanted reporter cells [n = 19 cells, except for wild type in wild type (n = 17)]. Genotypes of donor cells and host embryos are indicated in the embryo scheme (black: wild type; red: toddler−/−). x axis = margin; y axis = animal-vegetal axis; coordinate origin = start of track. (E) Quantification of track straightness. (F) Quantification of migration speed of cells tracked in (D). (G) Quantification of cell polarity of internalized cells represented as the percentage of frames in which a cell was polarized. (H) Quantification of lamellipodia represented as average number of lamellipodia detected per frame. (I) Rose plots showing relative enrichments of orientations of polarity and lamellipodia. Data are means ± SD. Significance was determined using one-way analysis of variance (ANOVA) with multiple comparison; ****P < 0.0001; **P < 0.01; *P < 0.05; n.s., not significant. Rose plots: 90° = animal pole; 0° = ventral/dorsal; −90° = vegetal pole. All graphs are oriented with the animal pole toward the top.
Fig. 2. Aplnr-expressing cells are attracted toward a local source of Toddler.
(A) Schematic representation of the experimental setup to test for Toddler functioning as a chemokine signal for Aplnr-expressing cells. Toddler-expressing cells, red; Aplnrb-expressing cells, blue. (B) Snapshots of a time-lapse confocal imaging series assessing the ability of Aplnrb-sfGFP–expressing toddler−/− cells to react to an ectopically located Toddler or control source. Top: Exposure of Aplnr-sfGFP–expressing cells (blue) to Toddler-deficient control cells (gray). n = 56 cells. Middle: Exposure of Aplnr-sfGFP–expressing cells to Toddler-overexpressing source cells (red). n = 65 cells. White arrows indicate contact between Aplnrb-sfGFP–expressing cells and Toddler source cells. Bottom: Exposure of cells deficient in Aplnr expression (gray) to Toddler-overexpressing source cells (red). n = 59 cells. (C) Cell tracks corresponding to conditions described in (B). Tracks were grouped by the distance of the cell from the source at the start of imaging (blue: <60 μm, purple: 60 to 100 μm, red: >100 μm). (D) Quantified track straightness of all Aplnrb-sfGFP–expressing and Aplnr-deficient cells that reach direct cell-cell contact with a Toddler-expressing source cell. Track straightness was compared before and after contact with the source cell. (E) Quantification of net displacement toward the source. All graphs and images are oriented with the source at the top.
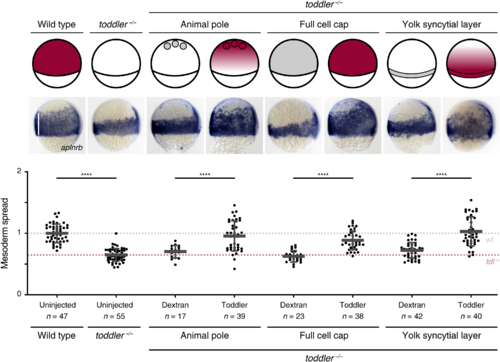
Fig. 3. Rescue of the toddler−/− phenotype is independent of the Toddler sources’ location.
Ectopic expression of Toddler in toddler−/− embryos according to the schematic representation of embryos at 75% epiboly (top). Animal pole source: transplantation of Toddler-overexpressing cells to the animal pole of sphere stage toddler−/− embryos; ubiquitous expression: injection of 2 pg of toddler mRNA (rescuing concentration) into one-cell stage toddler−/− embryos; marginal source: injection of 10 pg of toddler mRNA into the YSL of 1k-cell stage toddler−/− embryos. Toddler (red); Dextran control (gray). Mesoderm spread was assessed using in situ hybridization for aplnrb (middle; lateral view, dorsal on the right; white line indicates measurement of ventral mesoderm spread) and quantified relative to the average spread in wild-type embryos (bottom). Data are means ± SD. Significance was determined using one-way ANOVA with multiple comparison; ****P < 0.0001; **P < 0.01. Scale bars, 20 μm.
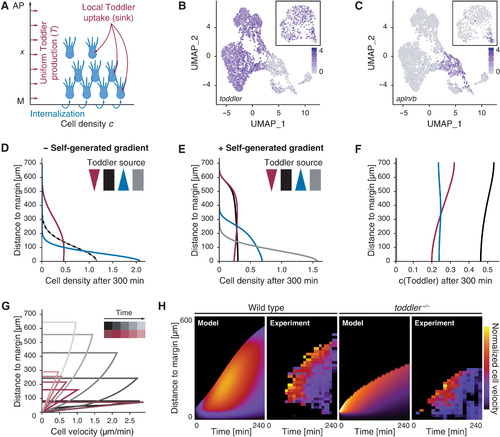
Fig. 4. Computational simulations predict a self-generated Toddler gradient.
(A) Schematic representation of the one-dimensional model of mesoderm density and Toddler concentration along the animal-vegetal axis (x = 0 denotes the margin, at which mesodermal cells are added). Toddler (red) is produced uniformly at rate T0 and is degraded locally by mesodermal cells (blue). (B and C) Uniform manifold approximation and projection (UMAP) clustering of single cells at 60% epiboly based on scRNA-seq data (24). Inset depicts UMAP at 30% epiboly. Color code represents expression levels of toddler (B) and aplnrb (C) in individual cells. (D and E) Predicted mesoderm density profiles (arbitrary units) after 300 min without (D) or with (E) Toddler uptake by mesoderm, for different profiles of Toddler production T0(x): graded toward the margin (blue), graded toward the animal pole (red), uniform (black), or no production (gray). (F) Predicted Toddler concentrations (arbitrary units) after 300 min with Toddler uptake by mesoderm. Profiles of Toddler productions T0(x) as described in (D) and (E). (G) Predicted spatiotemporal profiles of mesodermal cell velocities in wild-type (black) and toddler−/− embryos (red). (H) Predicted (model) and experimental (experiment) kymographs of mesodermal cell migration in wild-type (left) and toddler−/− (right) embryos. Experimental data from light sheet microscopy and tracking of drl:GFP-positive cells [N = 7 (wild type) and N = 6 (toddler−/−) embryos; average number of n = 195 cells tracked per embryo]. Color code represents normalized velocity (yellow: high; dark purple: low).
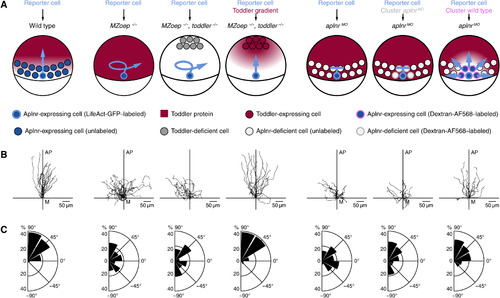
Fig. 5. Aplnr-expressing mesodermal cells are required to establish a Toddler gradient.
Cell transplantation assays to test for the necessity of Aplnr-expressing mesodermal cells as a Toddler sink. Transplanted LifeAct-GFP–labeled wild-type reporter cells were used as a read-out for the presence of a Toddler gradient. (A) Schematic representation of scenarios tested. From left to right: (i) Transplantation of reporter cells into a wild-type host embryo (n = 21). (ii) Transplantation of reporter cells into an MZoep−/− host embryo (n = 22). (iii) Transplantation of reporter cells into an MZoep−/−, toddler−/− double-mutant host embryo. Additional transplantation of Dextran–Alexa Fluor 568–labeled control source cells to the animal pole (n = 16). (iv) Transplantation of reporter cells into an MZoep−/−, toddler−/− double-mutant host embryo. Additional transplantation of Toddler-expressing source cells to the animal pole (n = 15). (v) Transplantation of reporter cells into an aplnr MO embryo (n = 20). (vi) Cotransplantation of one to five reporter cells and a large number of Dextran–Alexa Fluor 568–labeled Aplnr-deficient control cells into aplnrMO host embryo (n = 15). (vii) Cotransplantation of one to five reporter cells and a large number of Aplnr-expressing cells into aplnrMO host embryos (n = 16). (B) Tracks of transplanted reporter cells [order as described in (A)]. Cells were tracked for 90 min after internalization. x axis = margin; y axis = animal-vegetal axis; coordinate origin = start of track. (C) Rose plots showing relative enrichments of orientations of polarity. 90° = animal pole; 0° = ventral/dorsal; −90° = vegetal pole.
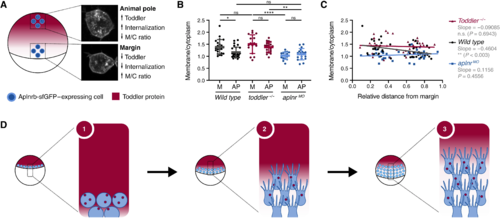
Fig. 6. Aplnrb-sfGFP internalization allows detection of a Toddler concentration gradient.
(A) Schematic representation of transplantation assay in a wild-type host embryo. Transplantation of Aplnrb-sfGFP–expressing toddler−/− cells to the animal pole and margin of the host embryo. Insets display representative confocal images of transplanted cells at animal pole and margin in a wild-type host embryo. (B) Quantification Aplnrb-sfGFP internalization levels of marginal (M) and animal pole (AP)–located transplanted cells in wild-type [n(M) = 22, n(AP) = 29], toddler−/− [n(M) = 16, n(AP) = 21], or aplnrMO [n(M) = 17, n(AP) = 18] host embryos, as determined by the ratio of membrane to cytoplasm fluorescence intensity. (C) Ratio of membrane to cytoplasm fluorescence intensity of transplanted cells relative to their distance to the margin. P value indicates significance of regression being different to 0 as determined by F test. (D) Schematic representation of the self-generated Toddler gradient: (i) Toddler is ubiquitously expressed throughout the embryo cap. Mesodermal progenitors internalize at the margin and express Aplnr, which acts as a scavenger receptor for Toddler. (ii) Aplnr binds and internalizes Toddler, which generates a local Toddler concentration gradient in front of the mesodermal cells, providing a directional cue. (iii) Aplnr also acts as a chemokine receptor to sense the self-generated Toddler guidance cue and induces the directed migration of mesodermal cells toward the animal pole, while continuously internalizing Toddler and shaping the local gradient. Data are means ± SD. Significance was determined using one-way ANOVA with multiple comparison; ****P < 0.0001; **P < 0.01; *P < 0.05.
Acknowledgments
This image is the copyrighted work of the attributed author or publisher, and
ZFIN has permission only to display this image to its users.
Additional permissions should be obtained from the applicable author or publisher of the image.
Full text @ Sci Adv
Your Input Welcome
Thank you for submitting comments. Your input has been emailed to ZFIN curators who may contact you if
additional information is required.
Oops. Something went wrong. Please try again later.