
- Title
-
Phylogenetic and Expression Analysis of Fos Transcription Factors in Zebrafish
- Authors
- Kubra, K., Gaddu, G.K., Liongue, C., Heidary, S., Ward, A.C., Dhillon, A.S., Basheer, F.
- Source
- Full text @ Int. J. Mol. Sci.
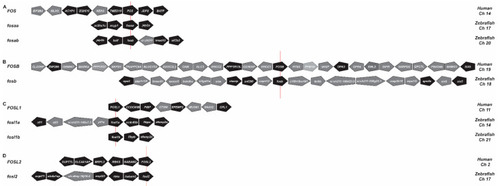
Synteny analysis of FOS genes. Human and zebrafish FOS (A), FOSB (B), FOSL1 (C), and FOSL2 (D) gene loci, indicating adjacent genes in their respective orientations. Zebrafish genes that share conserved synteny between human neighbouring genes are shown in black and non-syntenic genes in grey. The red line indicates the reference gene. Ch, chromosome. |
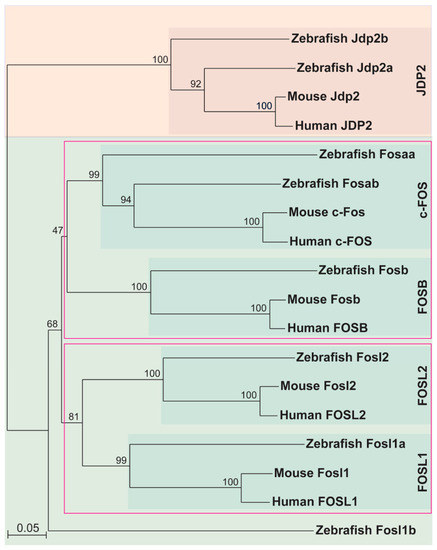
Phylogeny of mammalian and zebrafish FOS proteins. Phylogenetic analysis of human, mouse, and zebrafish FOS proteins were performed using the neighbour-joining algorithm and visualised with TreeView, with bootstrap values represented as a percentage of 1000 replicates and the relative evolutionary distance represented at the bottom left corner. JDP2 proteins were used as a closely related outgroup. Clades of related proteins are indicated within pink coloured boxes. |

Schematic representation of human and zebrafish FOS proteins. Depicted are human and zebrafish sequences related to c-FOS (A), FOSB (B), FOSL1 (C), and FOSL2 (D). Functional regions indicated are the basic leucine zipper (bZIP) including the basic region for DNA interaction (orange box) and leucine zipper for dimerization (red box), N-terminal transactivation domain (N-TA), homology box one and two (HOB1, HOB2), proline-rich motif (PRM), C-terminal transactivation motif (C-TM), transactivation domain (TBD), and destabiliser region (C-DEST). Previously characterised phosphorylation (P) sites curated in the Phosphosite database (phosphosite.org (accessed on 24 July 2022)) are indicated. The percentage identity within the bZIP domain and overall protein are indicated by blue dotted or solid lines and text, with the protein length indicated on the left in black text. |
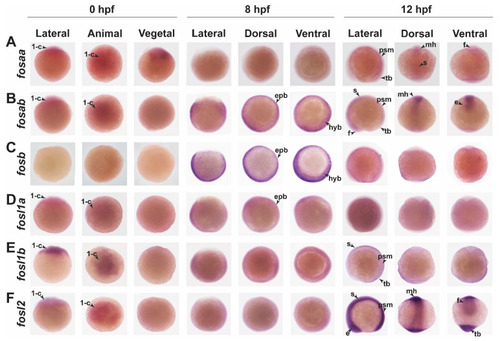
Spatiotemporal expression of fos genes during early zebrafish embryonic development. Lateral, dorsal, and frontal views of 0 hpf, 8 hpf, and 12 hpf zebrafish embryos analysed by WISH showing expression for fosaa (A), fosab (B), fosb (C), fosl1a (D), fosl1b (E), and fosl2 (F). 1-c, one cell; e, eye; epb, epiblast; f, forebrain; hyb, hypoblast; mh, mid and hindbrain; psm, presomitic mesoderm; s, somite; tb, tailbud. Black arrows within each panel point to the specific expression indicated by the abbreviation. EXPRESSION / LABELING:
|

Spatiotemporal expression of fos genes in later stages of zebrafish embryonic development. Lateral and dorsal views of zebrafish embryos analysed by WISH showing expression for fosaa at 24 hpf (A,A’), 48 hpf (B,B’), and 4 dpf (C,C’); fosab at 24 hpf (D,D’), 48 hpf (E,E’), and 4 dpf (F,F’); fosb at 24 hpf (G,G’), 48 hpf (H,H’), and 4 dpf (I,I’); fosl1a at 24 hpf (J,J’), 48 hpf (K,K’), and 4 dpf (L,L’); fosl1b at 24 hpf (M,M’), 48 hpf (N,N’), and 4 dpf (O,O’) and fosl2 at 24 hpf (P,P’), 48 hpf (Q,Q’), and 4 dpf (R,R’). cf, caudal fin; cl, cloaca; de, distal early of nephron; e, eye; ep, epidermis; f, forebrain; fr, fin ray; g, gut; h, hindbrain; hg, hatching gland; ht, heart; j, jaw; li, liver; lln, lateral line neuromasts; m, midbrain; mb, melanoblast; mff, median fin fold; mhb, midbrain hind brain barrier; mnc, migratory neural crest cell; mo, medulla obolongata; mt, mouth; nt, notochord; ob, olfactory bulb; ot, optic tectum; ov, otic vesicle; p, pancreas; pa, pharyngeal arches; pal, pallium; pe, peridermis; pf, pectoral fin; pnc, posterior notochord; pst, proximal straight tubule of nephron; rhb, rostral hindbrain; s, somite; tb, tailbud. Black arrows within each panel point to the specific expression indicated by abbreviations. EXPRESSION / LABELING:
|

Relative expression of fos genes in male and female zebrafish adult tissues. mRNA expression levels of fosaa (A), fosab (B), fosb (C), fosl1a (D), fosl1b (E), and fosl2 (F) in zebrafish adult male tissues eyes, brain, heart, kidney, spleen, intestine, skin, gills, testis, and liver were determined by qRT-PCR. The relative mRNA levels were normalised to actb and ddct values determined by comparison with expression in the male eyes, the tissue with moderate expression. The black error bars indicate the standard error of mean for four biological replicates and the dotted line indicates the median in a tissue showing moderate expression. EXPRESSION / LABELING:
|
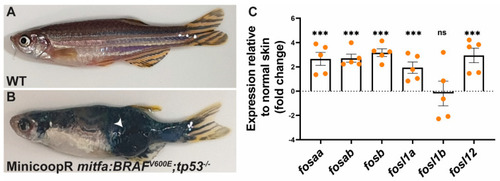
Relative expression of fos genes in human BRAFV600E oncogene driven melanoma in zebrafish. mRNA expression levels of zebrafish fos genes were determined in normal wildtype (WT) skin (A) and melanoma tumour from BRAFV600E; tp53−/− zebrafish line (B), with the graph showing the expression relative to the normal skin (fold change) (C). The relative mRNA levels were normalised to actb and ddct values determined by comparison with expression in the normal wildtype skin. Error bars indicate the standard error of mean for five biological replicates with statistical significance indicated (*** p < 0.001, ns not significant). The white arrow indicates the tumour. |