
FIGURE
Fig. 2
- ID
- ZDB-FIG-220912-23
- Publication
- Kubra et al., 2022 - Phylogenetic and Expression Analysis of Fos Transcription Factors in Zebrafish
- Other Figures
- All Figure Page
- Back to All Figure Page
Fig. 2
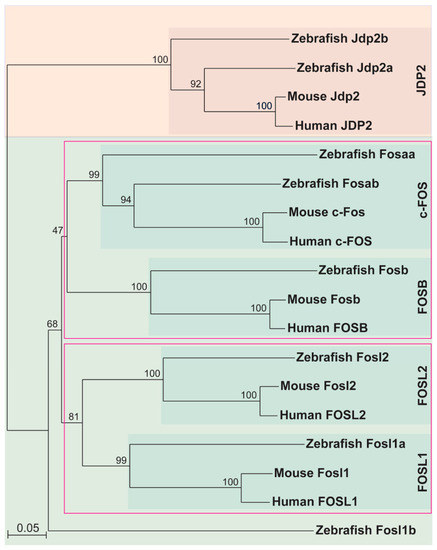
Phylogeny of mammalian and zebrafish FOS proteins. Phylogenetic analysis of human, mouse, and zebrafish FOS proteins were performed using the neighbour-joining algorithm and visualised with TreeView, with bootstrap values represented as a percentage of 1000 replicates and the relative evolutionary distance represented at the bottom left corner. JDP2 proteins were used as a closely related outgroup. Clades of related proteins are indicated within pink coloured boxes. |
Expression Data
Expression Detail
Antibody Labeling
Phenotype Data
Phenotype Detail
Acknowledgments
This image is the copyrighted work of the attributed author or publisher, and
ZFIN has permission only to display this image to its users.
Additional permissions should be obtained from the applicable author or publisher of the image.
Full text @ Int. J. Mol. Sci.