
- Title
-
Decabromodiphenyl ethane induced hyperactivity in developing zebrafish at environmentally relevant concentrations
- Authors
- Hua, J., Wang, X., Zhu, J., Wang, Q., Zhang, W., Lei, L., Zhu, B., Han, J., Yang, L., Zhou, B.
- Source
- Full text @ Ecotoxicol. Environ. Saf.
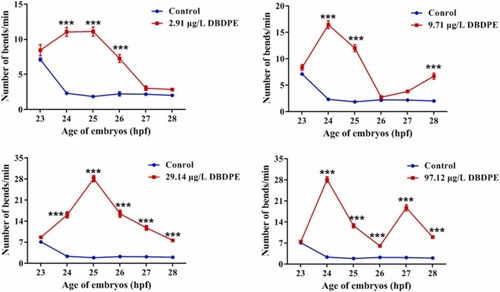
Fig. 1. Spontaneous movements recorded hourly from 23 to 28 hpf in zebrafish embryos/larvae following exposure to DBDPE from 2 hpf until 120 hpf. Data are expressed as mean ± SEM (60 individuals per group). * p < 0.05, * * p < 0.01 and * ** p < 0.001 indicate significant difference detected between exposure groups and control group. |
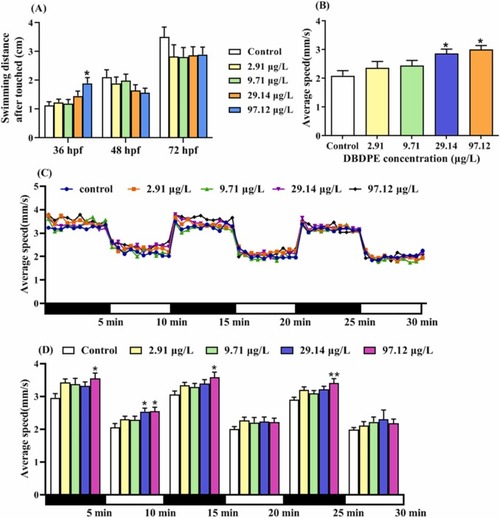
Fig. 2. Touch response and locomotor behavioral changes in zebrafish embryos/larvae following exposure to DBDPE from 2 hpf until 120 hpf. (A) Touch response measured at 36, 48 and 72 hpf (48 individuals per group). (B) Free-swimming activity detected under 10 min continuous visible light at 120 hpf (24 individuals per group). (C) Locomotor traces during the dark-light-dark photoperiod stimulation test performed at 120 hpf. (D) Average swimming speeds at 120 hpf in response to dark-to-light photoperiod stimulation (24 individuals per group). Data are expressed as mean ± SEM. * p < 0.05 and * * p < 0.01 indicate significant difference detected between exposure groups and control group. |
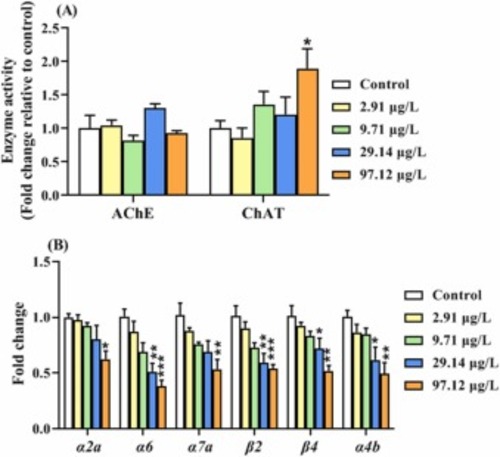
Fig. 3. Changes in AChE and ChAT activity (A) and transcriptions of nAChRs (B) in larval zebrafish at 120 hpf following exposure to DBDPE from 2 hpf until 120 hpf. Data are expressed as mean ± SEM (n = 4). * p < 0.05, ** p < 0.01 and *** p < 0.001 indicate significant difference detected between exposure groups and control group. |
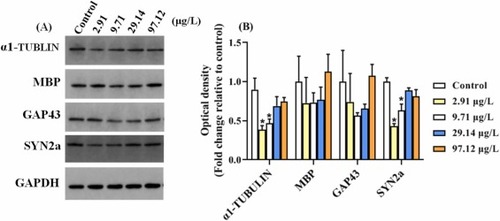
Fig. 4. Altered expressions of proteins associated with CNS development in larval zebrafish at 120 hpf following exposure to DBDPE from 2 hpf until 120 hpf. (A) Western blot analyses carried out with antibodies against α1-TUBULIN, MBP, GAP43, SYN2α and GAPDH in larval zebrafish exposed to DBDPE. (B) Quantification of abundances of the four proteins relative to the control. Data are represented as the mean ± SEM value from four replicates. * p < 0.05 indicates significant difference relative to the control. |
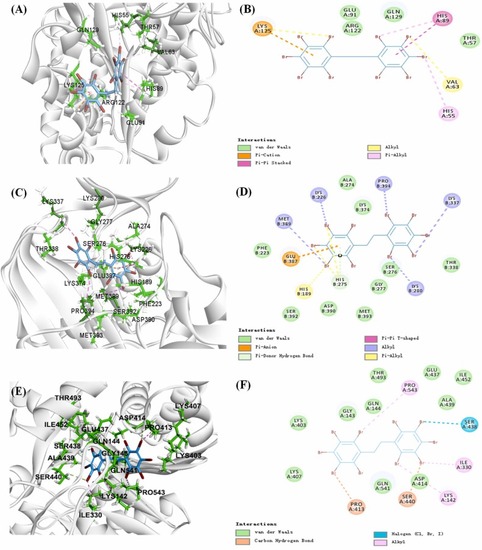
Fig. 5. Molecular docking of DBDPE with neurodevelopment associated proteins α1-TUBULIN (A, B), Synapsin II (SYN2a) (C, D) and ChAT (E, F). The dashed line represents the interactions between the ligand (DBDPE) and the target proteins. |