
Image
|
Figure Caption
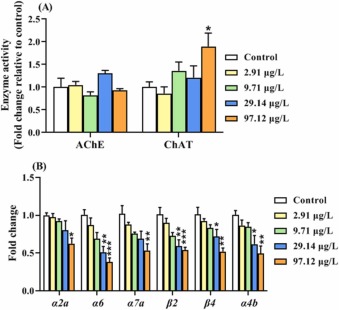
Fig. 3 Fig. 3. Changes in AChE and ChAT activity (A) and transcriptions of nAChRs (B) in larval zebrafish at 120 hpf following exposure to DBDPE from 2 hpf until 120 hpf. Data are expressed as mean ± SEM (n = 4). * p < 0.05, ** p < 0.01 and *** p < 0.001 indicate significant difference detected between exposure groups and control group.
Acknowledgments
This image is the copyrighted work of the attributed author or publisher, and
ZFIN has permission only to display this image to its users.
Additional permissions should be obtained from the applicable author or publisher of the image.
Full text @ Ecotoxicol. Environ. Saf.