
|
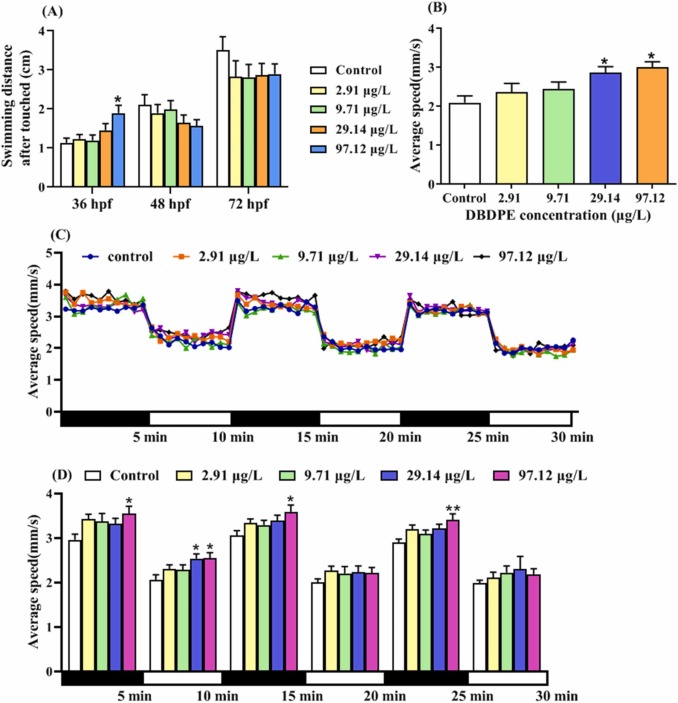
Fig. 2 Fig. 2. Touch response and locomotor behavioral changes in zebrafish embryos/larvae following exposure to DBDPE from 2 hpf until 120 hpf. (A) Touch response measured at 36, 48 and 72 hpf (48 individuals per group). (B) Free-swimming activity detected under 10 min continuous visible light at 120 hpf (24 individuals per group). (C) Locomotor traces during the dark-light-dark photoperiod stimulation test performed at 120 hpf. (D) Average swimming speeds at 120 hpf in response to dark-to-light photoperiod stimulation (24 individuals per group). Data are expressed as mean ± SEM. * p < 0.05 and * * p < 0.01 indicate significant difference detected between exposure groups and control group.