
- Title
-
Exploring Quercetin Anti-Osteoporosis Pharmacological Mechanisms with In Silico and In Vivo Models
- Authors
- Hu, Y., Yuan, W., Cai, N., Jia, K., Meng, Y., Wang, F., Ge, Y., Lu, H.
- Source
- Full text @ Life (Basel)

A two-set Venn diagram illustrating the relationship between QCT and OP-related targets. Light green and red represent QCT and OP-related targets, respectively. The intersection depicts a total of 55 potential pharmacological targets for QCT in the treatment of OP. |

PPI network graph of potential targets. The node size is proportional to its degree value where the bigger size means the larger degree value. |
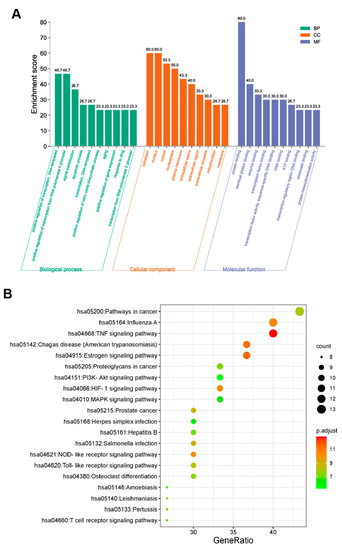
GO terms and KEGG pathway enrichment analysis of 30 common targets ( |
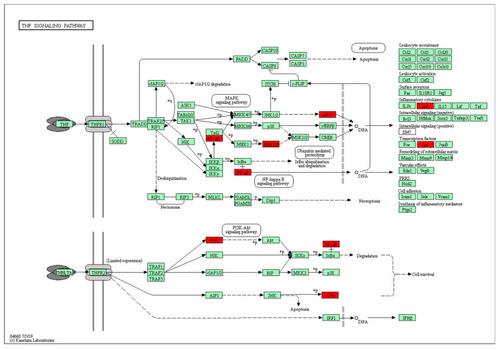
Potential hub targets of QCT toward anti-OP activity in the TNF signaling pathway generated by the KEGG mapper. The red rectangles indicate the identified proteins and the green rectangles indicate the unidentified proteins. |
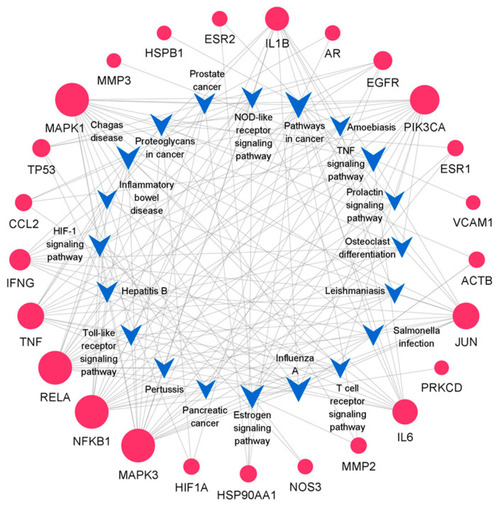
Target-pathway network. The blue V-shaped patterns and red circles represent different pathways and targets. The size of the circle indicates the degree of importance in the pathway. |
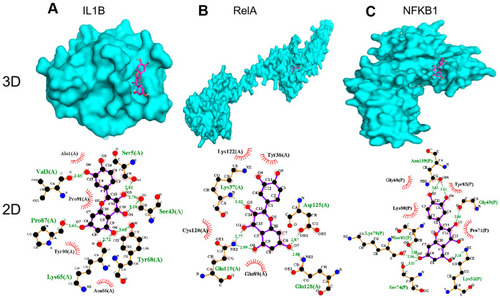
Molecular models of QCT binding to its predicted protein targets: ( |
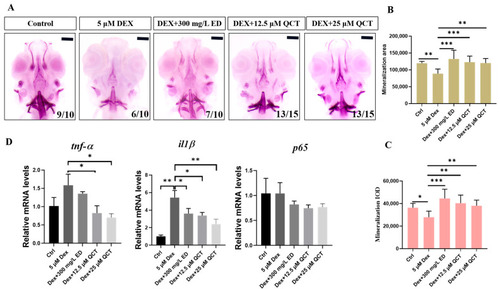
The effects of QCT on osteoporosis in zebrafish model. ( |