
- Title
-
Macrophages Break Interneuromast Cell Quiescence by Intervening in the Inhibition of Schwann Cells in the Zebrafish Lateral Line
- Authors
- Lin, M.J., Lee, C.M., Hsu, W.L., Chen, B.C., Lee, S.J.
- Source
- Full text @ Front Cell Dev Biol
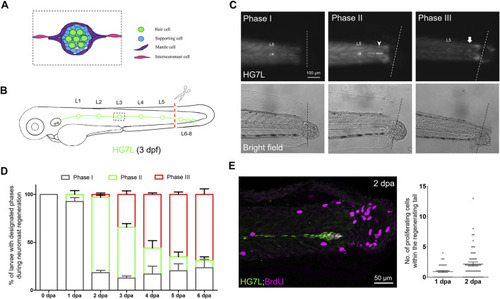
Active cell proliferation and clustering occur during neuromast regeneration upon fin amputation. (A) A cartoon shows different cell types in a neuromast of the lateral line. (B) A graph shows only one side of the fluorescent posterior lateral (green) with L1-8 neuromasts of an Et(HG7L) larva at three days post-fertilization. The tail fin is clipped at the dashed line to remove neuromast L6-8. (C) A new neuromast was regenerated in three distinct phases as examined at the GFP channel under epifluorescent microscopy. Phase I: No notable increase in fluorescent cells was observed in the lateral line between the L5 neuromast (as labeled) and the cut site (dotted line). Phase II: Fluorescent cells were increased and aggregated to form a cluster (arrowhead). Phase III: A new neuromast was formed (arrow). The corresponding bright-field images for each phase are shown below. (D) The percentages of larvae at each phase were calculated on the designated day postamputation (dpa, N = 3, n = 70). (E) Et(HG7L) larvae were fin-amputated, fixed at 1 and 2 dpa, and subjected to BrdU or EdU staining (in magenta) to probe actively proliferating cells or GFP immunohistochemistry (in green) to stain lateral line. Active cell proliferation was observed near the cutting edge at 2 dpa and quantified in a scatter plot on the right. |
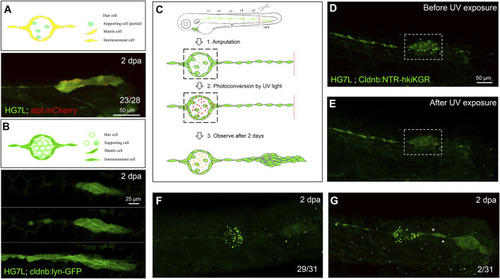
Interneuromast cells are the origin of clustering cells post–fin amputation. We performed fin amputation on double transgenic larvae from the cross of the Et(HG7L) with the Tg(−4.7alpl:mCherry) (alpl:mCherry) or Tg (−8.0cldnb:lyn-GFP) (cldnb:lynGFP) to track the origin of progenitor cells for the regenerating cluster post fin amputation at 2 days after amputation (2 dpa). (A) The regenerating cluster of fin-amputated larvae of Et(HG7L) X Tg (−4.7alpl: mCherry) line was examined at GFP or mCherry channel and photographed under confocal microscopy. A representative superimposed image from both channels is shown. The regenerating cluster image contains mostly yellow signals. As illustrated in the cartoon, the clustering cells could be originated from both interneuromast cells (INCs) and mantle cells (MCs). (B) The regenerating cluster of fin-amputated larvae of Et(HG7L) X Tg (−8.0cldnb: lyn-GFP) was examined at the GFP channel to scan the Z-axis. Images at three different z positions clearly show the existence of both membrane and cytosol green fluorescence. As illustrated in the cartoon, the signals could be originated from INCs, MCs, and supporting cells. (C) A series of cartoons shows utilizing a Tg(−8.0cldnb:NTR-hKikGR;myl7:EGFP) transgenic line, which expresses nitroreductase (NTR) and hKikGR fusion protein, to further discern whether the clustering cells are from INCs or cells inside a neuromast. To label the lateral line, we used larvae from the cross of Et(HG7L) (green) and Tg(−8.0cldnb:NTR-hKikGR;myl7:EGFP) (green dots), examined and photographed at the GFP channel before (D) and after UV exposure (E). After UV exposure, the green hKikGR dots were converted to red in all cell types, including MCs within distal neuromast right after fin amputation. (F) At 2 dpa, labeled cells generated new green hKikGR proteins. As shown in (F), the mingling of green and red signals becomes yellow. The labeled cells within the neuromasts rarely escaped in most treated larvae (29/31). However, we observed that a few larvae (2/31) showed yellow signals in the neighboring of INCs (white asterisks), as shown in (G). |
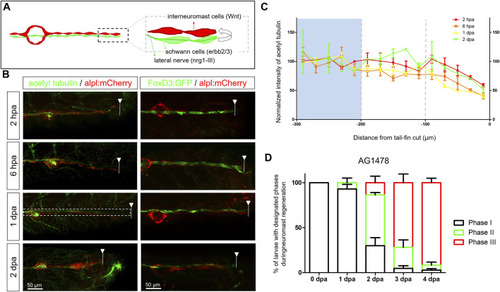
Diminished nerve inhibition near the cut site may allow neuromast regeneration from interneuromast cells. (A) A graph shows the close contact between interneuromast cells (INCs, red) with underlying Schwann cells (SWCs, light green) and posterior-lateral nerve (pLLn, dark green). The pLLn-derived nrg1-III can activate erbb2/3 receptors on SWCs to suppress Wnt activity in INCs, thus keeping INCs in a quiescent state. (B) The 3-dpf larvae from the cross of Tg(−4.7alpl:mCherry) and Tg(foxd3:EGFP) were tail fin–amputated and immobilized at the designated time to show the integrity of SWCs in green [labeled by Tg(FoxD3:GFP) in all stages examined (right column)]. Tg(−4.7alpl:mCherry) larvae at 3 dpf were also tail fin–amputated, fixed at designated hours or days post-amputation (hpa or dpa, respectively), and subjected to immunostaining against acetyl tubulin to reveal green nerves along the red lateral line (left column). The fluorescent intensity of green pLLn is diminishing, approaching the cut site (dashed line). So, we measured the green fluorescent intensity at decreasing distance from the cut site in cropped images as depicted by a dotted rectangle as shown in the image of a 1-dpa larva. The averaged intensity was calculated and normalized with those of the proximal region (200–300 μm from cutting edge, blue background) for designated times shown by different colors. (D) The Et(HG7L) larvae at 3 dpf were treated with 3 μM of AG1478 and fin-amputated to examine neuromast regeneration according to Figure 1C. Data are presented as mean ± s.e.m. |
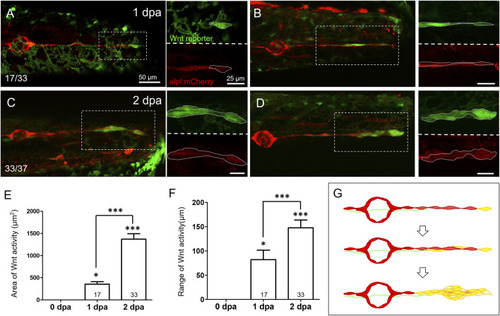
Wnt activity is enhanced in the lateral line near the injured site at 1–2 days post-injury. Representative superimposed stacked images of two different larvae (A‐C) and (B‐D) from the cross of Tg(6XTcf/LefBS-miniP:d2GFP) (green) and Tg(−4.7alpl:mCherry) (red) at 1-day post-amputation [dpa, (A‐B)] and 2 dpa (C‐D) are shown. Magnified diagrams for each dashed rectangle are shown next to the corresponding superimposed photo at the green or red channel. Elevated green Wnt activity outlined by white dashed lines was observed in the surrounding lateral line interneuromast cells near the wound site from 1 dpa. Scales are the same for all superimposed images (A). Scale bars are 25 μm in magnified images. (E‐F) The areas and range of Wnt activity, defined by measuring the extension from tail-cut to the most proximal end, were calculated and shown. Data represent mean ± s.e.m. and are analyzed by one-way ANOVA compared to 0 dpa. In addition, the difference between 1 and 2 dpa was analyzed and shown. *p < 0.05, ***p < 0.0005. (G) A series of cartoons illustrates Wnt activity elevation (yellow) during cluster formation. |
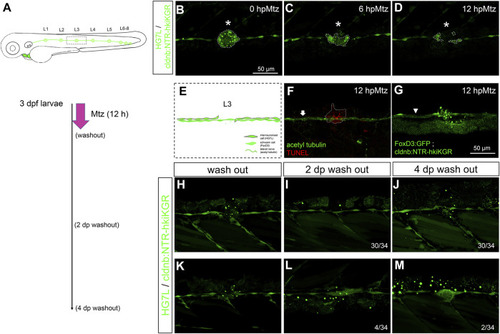
Chemical-genetic ablation of neuromasts blocks neuromast regeneration in most but not all larvae. (A) Larvae from the cross of Et(HG7L) (green) and Tg(−8.0cldnb:NTR-hkiKGR) (green dots) were treated with 2 mM metronidazole (Mtz) ob 3 days post-fertilization (dpf) for 12 h, washed out, cultured, examined, and photographed at designated h post-Mtz treatment (hpMtz) as shown in a series of cartoons. (B–D) Representative stacked images show decreasing size (enclosed by dashed lines) of neuromast (asterisks) during Mtz treatment. (E) A cartoon shows the absence of neuromast with undamaged Schwann cells and lateral nerve. (F) The TUNEL staining clearly labeled apoptotic cells in the Mtz-treated larva, and the lateral nerve (arrow) stayed undamaged. (G) Mtz was used to treat larvae from the cross of Tg (foxD3: GFP) and Tg (−8.0cldnb: NTR-hkiKGR). In a representative stacked image, Schwann cells (arrowhead pointed green rod) appeared intact compared to the disintegrating neuromast (asterisk). The faint broad green signal underneath is stacked signals from underlying tissues. (H–J) After washing out Mtz, most of the interneuromast cells (30/34) in the proximity of ablated neuromasts did not form a new neuromast. (K–M) A few (2/34) larvae had regenerated a neuromast (M) through cluster formation (4/34) (L). Scale bars are the same in all panels but are only shown in (B). |
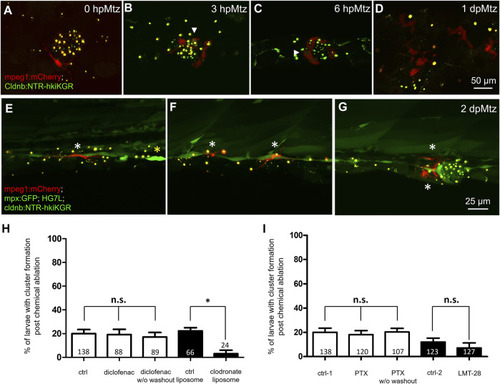
Changes in phagocytes surrounding deteriorating neuromasts and their effects on cluster formation. Larvae from the cross of Tg (mpeg1: mCherry) (red) and Tg(−8.0cldnb:NTR-hkiKGR;myl7:EGFP) (green) were treated with metronidazole (Mtz) as described in Figure 5, examined and photographed at designated hours or days post-Mtz treatment (hpMtz or dpMtz). We observed the disintegration of neuromasts post-Mtz treatment (A–D). Red macrophages (arrowheads) were recruited to engulf injured neuromasts in a dendritic cell-like shape within hours post-Mtz treatment (A–C). The injured neuromast disappeared, but macrophages were still retained in the injured site at 1dpMtz. Please note that the macrophages became more compact round in shape with protrusions (D). (E–G) Triple-transgenic larvae as designated were treated as described above, examined and photographed at 2 dpMz. Macrophages (red, white asterisks) were still found in the posterior lateral line system, even in a new neuromast, as shown in (G). In contrast, only a few neutrophils (bright green, yellow asterisks) were found. Scales are the same for each row but are only shown in the far-right panel. (H) We used larvae from the cross of Et(HG7L) and Tg(−8.0cldnb:NTR-hKikGR;myl7:EGFP). The larvae were treated without (ctrl) and with 3 μM diclofenac (with or without washout); control or clodronate liposome (H); or treated with different cytokine inhibitors PTX (35 μM) or LMT-28 (10 μM) (I). The above-treated larvae were undergone a 12-h Mtz treatment and scored for the % of larvae with cluster formation. Data represent mean ± s.e.m. and were analyzed by one-way ANOVA, *p < 0.05. n.s.: not significant. |
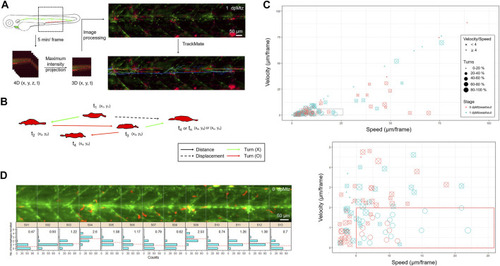
In toto imaging analysis reveals differential cell behaviors and specific spatial distribution of macrophages during neuromast regeneration. (A) The flowchart shows that the trunk region, including neuromast L3-5 was imaged in-toto by light-sheet fluorescence microscopy (LSFM) to monitor macrophage behavior during neuromast regeneration. Larvae from the cross of Tg(mpeg1:mCherry;FoxD3:GFP) and Tg(−8.0cldnb:NTR-hKikGR); Et(HG7L), a wide field of z-stack images focusing around the cloaca (dashed rectangle) was taken every 5 min. We then reduced the order to 3D (x,y,t) with the stacking of z-sections and processed it to have a better resolution by subtracting the background. Finally, we used the plugin “TrackMate” in the Fiji software and manually modified it to acquire the tracking path of every macrophage (shown in the right-bottom corner). (B) We measured the distance (arrows) and displacement (arrows with dashed lines) to calculate speed and Velocity, as shown in (C). Turns were counted among cell movements (indicated by red) to generate the ratio of turns in (C). (C) A scatter plot shows specific speed (the X-axis) and Velocity (the Y-axis) for each macrophage. Other features such as “Speed/Velocity”, “Ratio of turns” and “Stage” are also depicted as shown in the legends on the right to distinguish different cell behaviors better. A region with a speed lower than 25 and a velocity smaller than 10 (dashed rectangle) was magnified, as shown in the lower panel. (D) Histograms divided by sections (width of 100 μm) represent counts (the X-axis) of the different numbers of recruited macrophages (the Y-axis) during neuromast regeneration. In each panel, the mean of the “number of recruited macrophages” is shown in the right-upper graph and presented with dashed lines in red. |
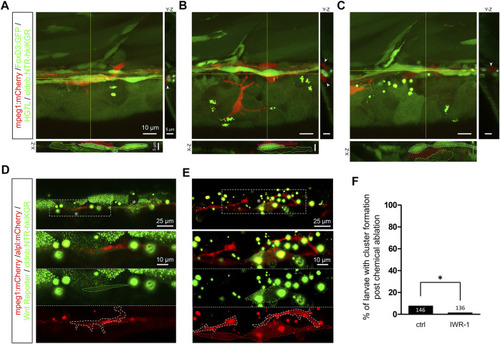
Infiltrated macrophages are found between Schwann cells and interneuromast cells with higher Wnt activity in Mtz-treated larvae. (A–C) Images shown are representative confocal stacked images of Mtz-treated larvae from the cross of Tg(mpeg1:mCherry;FoxD3:GFP) and Tg[−8.0cldnb:NTR-hKikGR;Et(HG7L)] in orthogonal views, while the X-Z and Y-Z views at the position of yellow lines are shown below and on the right side, respectively. Macrophages (red) indicated by red dashed outlines were mostly crawling on interneuromast cells (INCs, brighter green, marked by white dashed outlines) in (A–B). In some cases, macrophages were found between INCs and Schwann cells (SWCs, dim green, labeled by green dashed outlines) (C). Scale bars are the same but only provided in (A) for respective images. (D and E) Images presented are representative stacked confocal images of Mtz-treated larvae from the cross of Tg (mpeg1:mCherry;−8.0cldnb:NTR-hKikGR) and Tg(−4.7alpl:mCherry;6XTcf/LefBS-miniP:d2GFP). Areas shown higher Wnt activity are boxed with dash lines and indicated by asterisks. Magnified diagrams for the dashed rectangles are shown in different color channels to reveal INCs (red, top panel), Wnt signal (dim green, dashed region, middle panel), and macrophage (red, dashed region, bottom panel). Interestingly, some macrophages (enclosed with a white dashed line) interacted with these activated INCs. The scale bar goes to 25 μm or 10 μm in magnified diagrams. (F) Larvae were treated without (Ctrl) or with IWR-1 to disrupt Wnt activity, and the percentages of larvae with cluster formation were counted as described previously. Data represent mean ± s.e.m. and were analyzed by one-way ANOVA, *p < 0.05. |
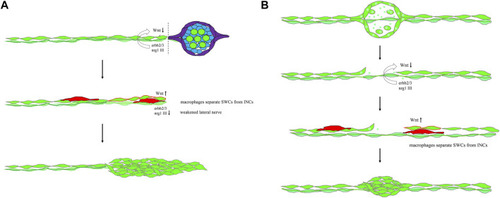
Mechanistic models for lateral line regeneration. (A) Under normal conditions, the pLLn (thick dark green thread) nrg1-III-activated erbb2/3 receptors within Schwann cells (SWCs, light green) keep interneuromast cells (INCs, bright green) quiescent by limiting the Wnt activity. Upon the loss of distal neuromasts by tail amputation, the lateral line nerve is weakened (thin light green thread) in the proximity of the cutting edge to break the quiescence of INCs (red outlines). The Wnt activity in INCs is elevated and results in cluster formation. (B) Upon specific ablation of neuromasts by NTR-hKikGR protein (bright green spots)-induced by Mtz without damaging surrounding posterior lateral line nerve and SWCs, INCs remain quiescent by integral EGF inhibition. Most macrophages crawl onto INCs, filling the gap without successful neuromast regeneration. However, occasionally macrophages could infiltrate in between INCs and SWCs. It breaks the contact between INCs and SWCs and the inhibition of EGF signaling. INCs are then activated to be able to differentiate and regenerate new neuromasts through cluster formation. |