
- Title
-
Neuropathy-associated Fars2 deficiency affects neuronal development and potentiates neuronal apoptosis by impairing mitochondrial function
- Authors
- Chen, X., Liu, F., Li, B., Wang, Y., Yuan, L., Yin, A., Chen, Q., Hu, W., Yao, Y., Zhang, M., Wu, Y., Chen, K.
- Source
- Full text @ Cell Biosci.

Distribution and conservation analysis of FARS2 pathogenic mutations. A Distribution of 30 missense mutations, 2 nonsense mutations, 6 inframe or outframe deletions and 1 splice-site mutation on human mtPheRS. B A graphical illustration of mtPheRS sequence conservation (black line) based on the ConSurf conservation score. Mutation sites (dots) are indicated |
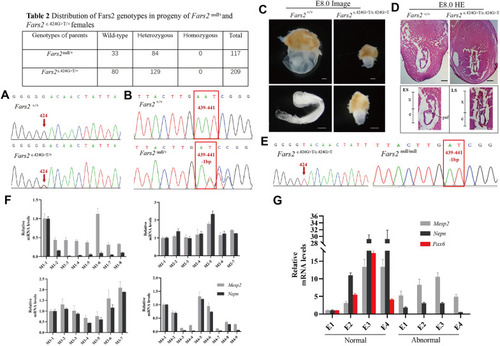
Homozygous Fars2 knockout or mutant result in early gestation lethality in mouse. A Genotype of wildtype and heterozygous Fars2 p.D142Y mutant mice, obtained by Sanger Sequencing. The red arrows indicate the 424 base site of Fars2 cDNA sequence. B Genotype of wildtype and heterozygous Fars2 knockout mice obtained by Sanger Sequencing. The red frames show the 439 to 441 base site of Fars2 cDNA sequence. C Lateral view of wildtype and homozygous Fars2 p.D142Y mutant mice embryos at E 7.5-8.0. Scale bar: 0.25 mm. D Hematoxylin and eosin staining of wildtype and homozygous Fars2 p.D142Y mutant mice embryos at E 7.5-8.0. Scale bar = 0.25 mm. e, embryonic portion of egg cylinder; ES, early streak stage; LS, late streak stage; x, extraembryonic portion of the egg cylinder; paf, posterior amniotic fold. E Genotype of homozygous Fars2 p.D142Y mutant and knockout mice obtained by Sanger Sequencing. The red arrows and frames respectively indicate the 424 base site and 439 to 441 base site of Fars2 cDNA sequence. F qRT-PCR analysis of four E 7.0-7.5 group littermates of Fars2 c.424G>T/+ intercrossing show that all individuals express Mesp2 and Nepn. G qRT-PCR analysis of four E 7.5-8.0 group littermates of Fars2 c.424G>T/+ intercrossing reveal that normal-shaped embryos express Mesp2, Nepn, and Pax6, while abnormal-shaped embryos only express Mesp2 and Nepn |
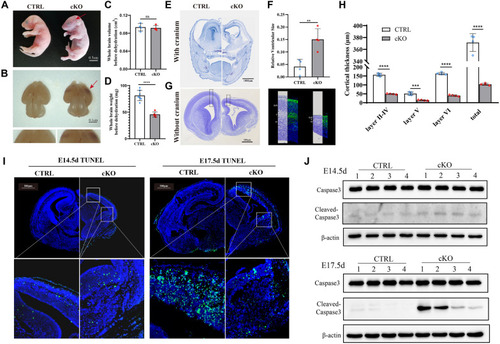
Conditional deletion of Fars2 in mice CNS results in neurodegenerative phenotypes. A The appearance of control (Nes-Cre−; Fars2 fl/fl) and cKO (Nes-Cre+; Fars2 fl/fl) embryos at P 0.5. The purple appearance of the stillbirth cKO embryo is indicated by the arrow. Scale bars: 0.5 cm. B The appearance of the whole brain from control and cKO embryos at E 17.5. The arrow shows red lesions on cerebral cortex of a cKO embryo. Scale bars: 0.1 cm. C The whole brain volume of cKO embryos before dehydration was comparable with control embryos (mean ± SD; two-tailed unpaired t-Test, ns: non-significant; n = 4). D The brain weight of cKO embryos before dehydration decreased compared with control embryos (mean ± SD; two-tailed unpaired t-Test, ****P < 0.0001; n = 4). E– F Nissl staining of coronal sections with cranium of control and cKO mice embryo at E 17.5. Scale bars: 1000 μm. Quantification of ventricle volume showed enlarged volume in cKO embryos compared with control embryos (mean ± SD; two-tailed unpaired t-Test, **P < 0.01; n = 4). G– H Nissl and immunofluorescence staining of coronal sections without cranium of control and cKO mice embryo at E 15.5. Scale bars: 500 μm. The neurons were stained with TUJ1 to help distinguish cortical layers. The layer thickness of cortical areas in control and cKO embryos was quantified (mean ± SD; two-tailed unpaired t-Test, ***P < 0.001; ****P < 0.0001; n = 4). ITUNEL staining of brain sections in control and cKO mice at the indicated embryonic ages. Scale bars: 500 μm. The white frames indicate the dorsal and ventral cortex region with positive signals. J Western blotting for Caspase 3 and Cleaved-caspase 3 in control and cKO mice at the indicated embryonic ages |
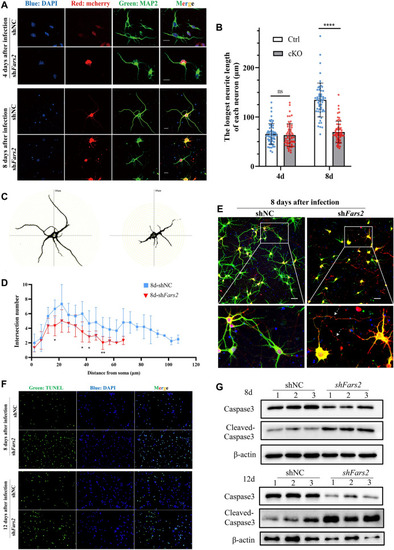
Fars2 depletion affects neurite outgrowth in primary cultured neurons and zebrafish motor neurons. A Immunofluorescence staining of primary cultured neurons at the indicated day of culture. Neurons were infected with lentivirus carrying mcherry (red), the neurites were labeled with MAP2 (green) and the nucleus with DAPI (blue). Scale bars: 20 μm. B Quantification of the longest neurite length at the indicated days (mean ± SD; two-tailed unpaired t-Test, ns: non-significant; ****P < 0.0001; n = 60). C–D Sholl analysis of control and Fars2 knocked-down neurons at the 8th day of culture (mean ± SD; two-tailed unpaired t-Test, *P < 0.5; **P < 0.01; n = 6). E Immunofluorescence staining of neurons at 8 days post-infection. Neurons were infected with lentivirus carrying mcherry (red), the neurites were labeled with MAP2 (green) and the nucleus with DAPI (blue). Arrowheads point to the fracture of axons. Scale bars: 50 μm. F TUNEL staining of control and Fars2 knocked-down neurons at the indicated days of culture. G Western blotting for Caspase 3 and Cleaved-caspase 3 in control and Fars2 knocked-down neurons at the indicated days in culture |

Translation and assembly of OXPHOS subunits are disrupted in Fars2-deficient samples. A–C Western blotting for OXPHOS complexes and the mitochondrial marker TOMM20 in control and cKO mice embryo cortex at indicated embryonic ages (mean ± SD; two-tailed unpaired t-Test, ns: non-significant; *P < 0.05; **P < 0.01; ***P < 0.001; ****P < 0.0001; n = 4). D–F Western blotting for ND1, CO2 and CYTB in control and cKO mice embryo cortex at the indicated embryonic ages (mean ± SD; two-tailed unpaired t-Test, ns: non-significant; *P < 0.05; **P < 0.01; ***P < 0.001; ****P < 0.0001; n = 4). G–H Western blotting for OXPHOS complexes and the mitochondrial marker TOMM20 in control and Fars2 knocked-down neurons at the indicated days of culture (mean ± SD; two-tailed unpaired t-Test, ns: non-significant; *P < 0.05; n = 3). I–J Western blotting for ND1 in control and Fars2 knocked-down neurons at 16 days of infection (mean ± SD; two-tailed unpaired t-Test, *P < 0.05; n = 3). K–L Quantification of TOMM20 in A, B and G (mean ± SD; two-tailed unpaired t-Test, ns: non-significant; n = 3–4). M RT-PCR analysis of OXPHOS subunits transcription levels in control and cKO mice embryo cortex at E 17.5 (mean ± SD; Two-tailed unpaired t-Test, ns: non-significant; *P < 0.05; **P < 0.01; n = 3–4). N qRT-PCR analysis of OXPHOS subunits transcription levels in control and Fars2 knocked-down neurons at 16 days after infection (mean ± SD; Two-tailed unpaired t-Test, ns: non-significant; *P < 0.05; **P < 0.01; n = 3) |
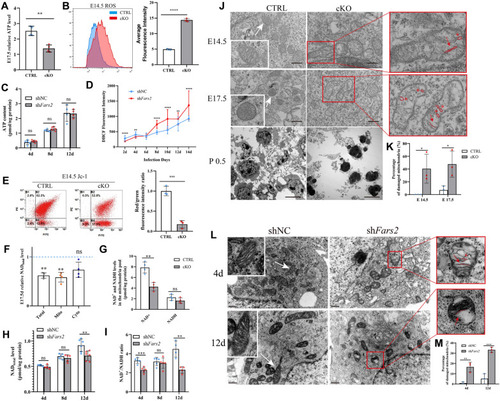
Effects of Fars2 deficiency on mitochondria. A–B ATP and ROS levels in the cortex of the cKO mouse embryo compared with control at E 14.5 (mean ± SD; Two-tailed unpaired t-Test, **P < 0.01; ****P < 0.0001; n = 6 for ATP; n = 3 for ROS). C–D TP and ROS levels in control and Fars2 knocked-down neurons at the indicated days of culture (mean ± SD; two-tailed unpaired t-Test, ns: non-significant; **P < 0.01; ****P < 0.0001; n = 4–5 for ATP; n = 27 for ROS). E Relative mitochondrial membrane potential in the cortex of the cKO mouse embryo compared with control at E 14.5 (mean ± SD; two-tailed unpaired t-Test, ***P < 0.001; n = 3). F Relative NADtotal level in the cortex of the cKO mouse embryo compared with control at E 17.5 (mean ± SD; two-tailed unpaired t-Test, ns: non-significant; **P < 0.01; n = 4). G NAD+ and NADH levels of mitochondria pool in control and cKO mice embryo cortex at E 17.5 (mean ± SD; two-tailed unpaired t-Test, ns: non-significant; **P < 0.01; n = 4). H–INADtotal levels and NAD+/NADH ratio in control and Fars2 knocked-down neurons at the indicated days of culture (mean ± SD; two-tailed unpaired t-Test, **P < 0.01; ***P < 0.001; ****P < 0.0001; n = 5–6). J Transmission electron micrograph of mitochondria in cortex from control and cKO mice embryos at the indicated embryonic ages. Scale bars: 0.5 μm for E 14.5 and E 17.5 samples and 5 μm for P 0.5 samples. K Percentage of mitochondria with abnormal cristae in CTRL and cKO cortex at indicated embryonic ages (mean ± SD; two-tailed unpaired t-Test, *P < 0.05; n = 3). L Transmission electron micrograph of mitochondria in control and Fars2 knocked-down neurons at the indicated days of culture. Linearized mitochondrial cristae and the geometrical shapes are indicated by red lines and asterisks. Scale bars: 0.5 μm. M Percentage of mitochondria with abnormal cristae in control and Fars2 knocked-down neurons at the indicated days of culture (mean ± SD; two-tailed unpaired t-Test, **P < 0.01; ***P < 0.001; n = 3) |
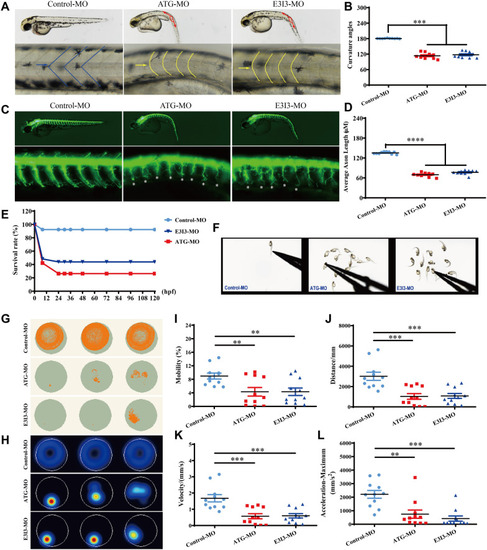
Locomotor capacity is reduced in fars2 morphants. A–B Gross morphology of Tg (hb9:eGFP) zebrafish embryos at 54-hpf. hpf, hours post fertilization. Compared with control-MO, fars2 morphants present a curved body axis (blue dotted line) and U-shaped somites (yellow line and arrow). Quantification of the average curvature angle (mean ± S.E.M; One-way ANOVA with Bonferroni posthoc test, ***P < 0.001; n = 10). C Gross morphology of Tg (hb9:eGFP) zebrafish embryos at 54-hpf. Red lines depict the definition of curvature angle, asterisk indicates impaired motor axon. D Quantification of the average motor axon length reveals a decrease in fars2 morphants (mean ± S.E.M; One-way ANOVA with Bonferroni posthoc test, ****P < 0.0001; n = 10). E Time-course of percent survival in control vs. fars2 morphants for 5 days. n = 100. F The stereotypic escape response, normal in control larvae but highly reduced or absent in fars2 morphants. G–H Digital tracks and heat-map image in larvae from control-MO and fars2-MO injected groups at 5 dpf. dpf, days post fertilization. n = 10. I–L Total movement distance, velocity, mobility and maximum acceleration in fars2-MO group are significantly lower than those in the control-MO injected groups (mean ± S.E.M; One-way ANOVA with Bonferroni posthoc test, **P < 0.01; ***P < 0.001; n = 11). |
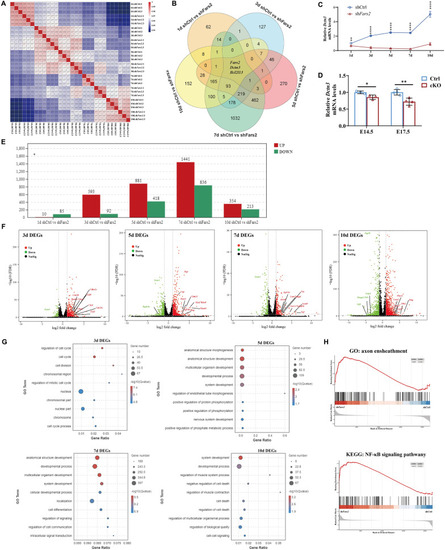
RNA-sequencing analysis of Fars2 knockdown effect in mouse neurons in vitro. A Pearson correlation value of gene expression between samples based on RNA-seq. Each row and column of the figure both represent samples, the number and the square color below represent the correlation value between pair of samples. The more two samples are similar with each other, the closer the correlation value is to 1. B Venn diagram showing the distribution of unique and common DEGs among comparisons at different culture days. C qRT-PCR-based validation of Dctn3 expression in primary cultured neurons at different time points. (mean ± SD; two-tailed unpaired t-Test, **P < 0.01; ****P < 0.0001; n = 3). D qRT-PCR-based validation of Dctn3 expression in mouse cortex at different embryonic day. (mean ± SD; two-tailed unpaired t-Test, *P < 0.05; **P < 0.01; n = 3-4). E DEGs numbers in shFars2 vs shCtrl group at 1, 3, 5, 7, 10 days post-infection (n = 3 from different littermates for each group). Adjust P < 0.05 and |logFC|≥ 2 were set as the cut-off criteria. F Volcano plot of the DEGs in shFars2 vs shCtrl group at 3, 5,7,10 days after infection. Red dots represent up-regulated genes, green dots represent down-regulated genes, black dots represent genes with no significantly changes. G GO term enrichment analysis of DEGs between the Fars2-knockdown group versus the control group at 3, 5, 7, 10 days post-infection. The P-value has undergone FDR Correction (FDR ≤ 0.05). Gradation of dot color represents statistical significance and the size represents the number of implicated genes. H GSEA of primary cultured neuron transcriptomes revealed that genes involved in axon ensheathment and NF-κB signaling pathway are respectively upregulated at 7th and 10th day after infection in Fars2 knocked-down group |
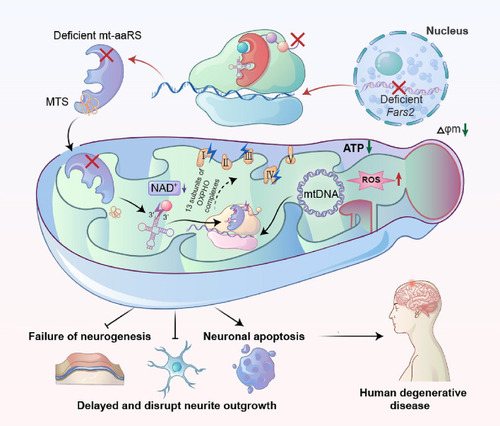
Neuropathy-associated Fars2 deficiency affects neuronal development, potentiates neuronal apoptosis by impairing mitochondrial function. An overview of the mechanisms by which Fars2 deficiency disrupts mitochondrial translation, which leads to neuronal apoptosis and possibly neurodegenerative diseases |

ZFIN is incorporating published figure images and captions as part of an ongoing project. Figures from some publications have not yet been curated, or are not available for display because of copyright restrictions. EXPRESSION / LABELING:
|