
Fig. 8
- ID
- ZDB-FIG-220715-37
- Publication
- Chen et al., 2022 - Neuropathy-associated Fars2 deficiency affects neuronal development and potentiates neuronal apoptosis by impairing mitochondrial function
- Other Figures
- All Figure Page
- Back to All Figure Page
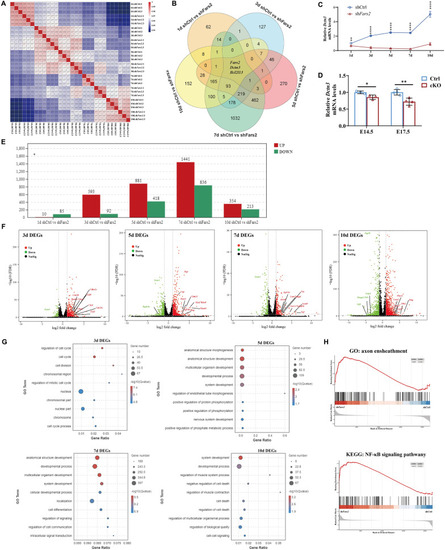
RNA-sequencing analysis of Fars2 knockdown effect in mouse neurons in vitro. A Pearson correlation value of gene expression between samples based on RNA-seq. Each row and column of the figure both represent samples, the number and the square color below represent the correlation value between pair of samples. The more two samples are similar with each other, the closer the correlation value is to 1. B Venn diagram showing the distribution of unique and common DEGs among comparisons at different culture days. C qRT-PCR-based validation of Dctn3 expression in primary cultured neurons at different time points. (mean ± SD; two-tailed unpaired t-Test, **P < 0.01; ****P < 0.0001; n = 3). D qRT-PCR-based validation of Dctn3 expression in mouse cortex at different embryonic day. (mean ± SD; two-tailed unpaired t-Test, *P < 0.05; **P < 0.01; n = 3-4). E DEGs numbers in shFars2 vs shCtrl group at 1, 3, 5, 7, 10 days post-infection (n = 3 from different littermates for each group). Adjust P < 0.05 and |logFC|≥ 2 were set as the cut-off criteria. F Volcano plot of the DEGs in shFars2 vs shCtrl group at 3, 5,7,10 days after infection. Red dots represent up-regulated genes, green dots represent down-regulated genes, black dots represent genes with no significantly changes. G GO term enrichment analysis of DEGs between the Fars2-knockdown group versus the control group at 3, 5, 7, 10 days post-infection. The P-value has undergone FDR Correction (FDR ≤ 0.05). Gradation of dot color represents statistical significance and the size represents the number of implicated genes. H GSEA of primary cultured neuron transcriptomes revealed that genes involved in axon ensheathment and NF-κB signaling pathway are respectively upregulated at 7th and 10th day after infection in Fars2 knocked-down group |