
- Title
-
Gene copy number and negative feedback differentially regulate transcriptional variability of segmentation clock genes
- Authors
- Zinani, O.Q.H., Keseroğlu, K., Dey, S., Ay, A., Singh, A., Özbudak, E.M.
- Source
- Full text @ iScience
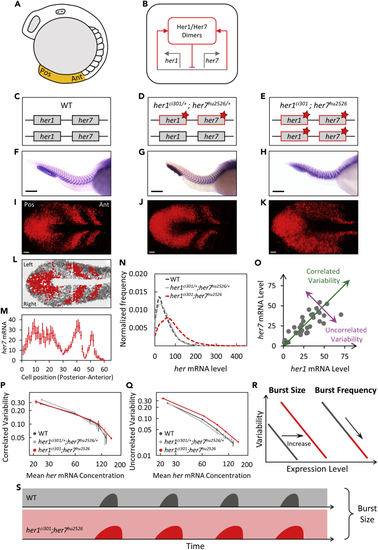
Negative feedback loop established by Her1/7 proteins suppresses uncorrelated transcriptional variability (A) The sketch of a wild-type zebrafish embryo at the 12-somite stage. The PSM, highlighted in orange, is dissected from the embryo for confocal imaging. Anterior (Ant) is to the right, and posterior (Pos) is to the left. (B) Her1 and Her7 repress transcription of their own genes, and thereby form a cell-autonomous negative feedback loop. (C–E) Red stars (∗) mark her1 and her7 genes carrying point mutations causing premature stop codons. (F–H) The boundaries of somite segments are marked by xirp2 ISH staining in wild-type (F), her1ci301/+;her7hu2526/+ (G), and her1ci301;her7hu2526 mutants (H). Scale bar is 200 μm. (I-J) Expression of her7 displays kinematic waves and oscillations in wild-type (I) and her1ci301/+;her7hu2526/+ (J) mutants. (K) Expression pattern of her7 is disrupted in double homozygous her1ci301;her7hu2526 mutants. Scale bar is 30 μm. (L) The PSM is divided into single-cell width slices. Red or gray circles represent the cells, which contain higher or lower RNA levels than an arbitrary threshold, respectively. Three oscillatory waves of her7 are visible. The images are divided into two portions as left (top) and right (bottom) halves of the PSM. (M) her7 RNA counts are plotted along the right half of PSM (posterior-to-anterior). Each dot corresponds to the mean RNA number in a sliced cell population. Error bars are 2 SEM. (N) The frequency histogram of total her (her1+her7) RNA per cell is plotted in wild-type (dark gray) (n=24, N=2), her1ci301/+;her7hu2526/+ (silver) (n=18, N=2), her1ci301;her7hu2526 (red) (n=28, N=2) mutant embryos. (O) Each dot represents her1 (x axis) and her7 (y axis) counts in a single cell. Correlated (green) and uncorrelated (purple) variability of her expression can be quantified in the population. (P and Q) Correlated (P) and uncorrelated (Q) transcriptional variability of her1 and her7 are plotted based on mean her RNA concentration (mRNA counts normalized by cell volume). Error bars are two standard errors. (R) Changing the size or frequency of transcriptional bursts affect the variability curve (CV2 vs. mean) differently. (S) Loss of Her proteins results in more uncorrelated transcriptional variability most likely due to increased burst sizes in her1ci301;her7hu2526 mutants. n is the number of embryos; N is the number of independent experiments. See also Figure S1. |
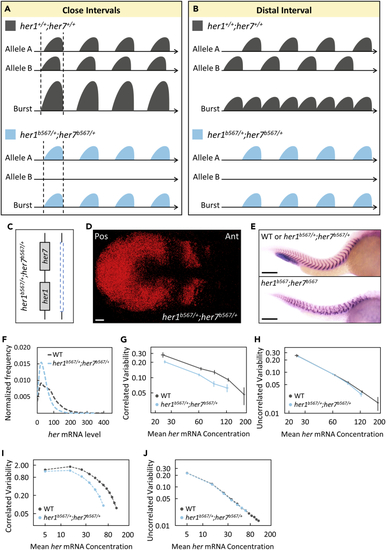
Clock gene dosage increases correlated transcriptional variability (A and B) Reduced gene copy in her1b567/+;her7b567/+ mutants results in decreased burst sizes or frequency if two homologous alleles cofire with either close (A) or distal (B) interval, respectively. (C) One of the chromosomes has a large deletion including the her1-her7 locus in her1b567/+;her7b567/+ mutants. (D) A her1b567/+;her7b567/+ embryo with normal kinematic waves of her7 transcription. Scale bar is 30 μm. (E) The boundaries of somite segments are marked by xirp2 ISH staining in sibling (top) wild-type or heterozygous her1b567/+;her7b567/+ and (bottom) homozygous her1b567;her7b567 mutant embryos. Scale bar is 200 μm. (F) her1b567/+;her7b567/+ embryos (n=24, N=2) have less her mRNA than wild-type (n=14, N=2). The frequency histogram of total her (her1+her7) RNA per cell is plotted in wild-type (dark gray), her1b567/+;her7b567/+ mutant (light blue) embryos. (G and H) her1b567/+;her7b567/+ embryos have reduced correlated transcriptional variability than wild-type (G), but uncorrelated transcriptional variability changed mildly (H). Reduced correlated transcriptional variability can be explained by reduced burst size in her1b567/+;her7b567/+ embryos than in wild-type. (I and J) Computational model also shows more reduced correlated variability (I) in her1b567/+;her7b567/+ embryos than in wild-type embryos compared to uncorrelated variability (J). Error bars are two standard errors. n is the number of embryos; N is the number of independent experiments. See also Tables S1–S3. |
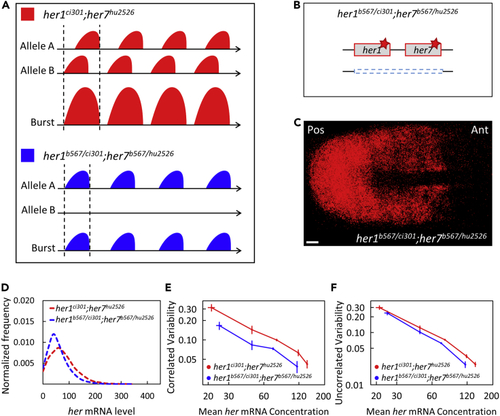
Clock gene dosage increases correlated transcriptional variability more than uncorrelated one (A) Reduced copy of her genes likely results in decreased burst sizes in her1b567/ci301;her7b567/hu2526 mutants compared to her1ci301;her7hu2526 mutants. (B) One of the chromosomes has mutant her1 and her7 genes whereas the other has a large deletion including the her1-her7 locus in her1b567/ci301;her7b567/hu2526 mutants. Red stars (∗) mark point mutations causing premature stop codons. (C) Expression pattern of her7 is disrupted in her1b567/ci301;her7b567/hu2526 embryos. Scale bar is 30 μm. (D) her1b567/ci301;her7b567/hu2526 embryos (n=12, N=2) have less her mRNA than double homozygous her1ci301;her7hu2526 embryos (n=17, N=2). The frequency histogram of total mutant her (her1+her7) RNA per cell is plotted in her1ci301;her7hu2526 (red), her1b567/ci301;her7b567/hu2526 mutant (blue) embryos. (E and F) her1b567/ci301;her7b567/hu2526 embryos have both reduced correlated (E) and uncorrelated (F) transcriptional variability than her1ci301;her7hu2526. Error bars are two standard errors. n is the number of embryos; N is the number of independent experiments. |