
Fig. 2
- ID
- ZDB-IMAGE-220707-10
- Publication
- Zinani et al., 2022 - Gene copy number and negative feedback differentially regulate transcriptional variability of segmentation clock genes
- All Figures
- Figures for Zinani et al., 2022
|
Fig. 2
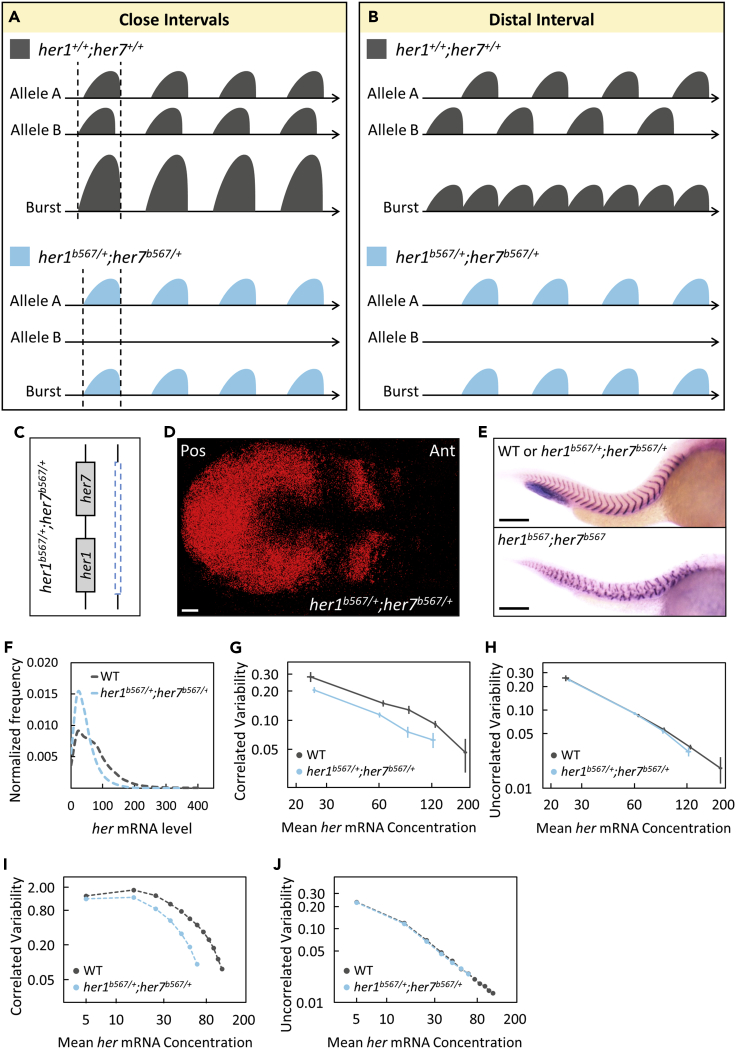
Clock gene dosage increases correlated transcriptional variability
(A and B) Reduced gene copy in her1b567/+;her7b567/+ mutants results in decreased burst sizes or frequency if two homologous alleles cofire with either close (A) or distal (B) interval, respectively.
(C) One of the chromosomes has a large deletion including the her1-her7 locus in her1b567/+;her7b567/+ mutants.
(D) A her1b567/+;her7b567/+ embryo with normal kinematic waves of her7 transcription. Scale bar is 30 μm.
(E) The boundaries of somite segments are marked by xirp2 ISH staining in sibling (top) wild-type or heterozygous her1b567/+;her7b567/+ and (bottom) homozygous her1b567;her7b567 mutant embryos. Scale bar is 200 μm.
(F) her1b567/+;her7b567/+ embryos (n=24, N=2) have less her mRNA than wild-type (n=14, N=2). The frequency histogram of total her (her1+her7) RNA per cell is plotted in wild-type (dark gray), her1b567/+;her7b567/+ mutant (light blue) embryos.
(G and H) her1b567/+;her7b567/+ embryos have reduced correlated transcriptional variability than wild-type (G), but uncorrelated transcriptional variability changed mildly (H). Reduced correlated transcriptional variability can be explained by reduced burst size in her1b567/+;her7b567/+ embryos than in wild-type.
(I and J) Computational model also shows more reduced correlated variability (I) in her1b567/+;her7b567/+ embryos than in wild-type embryos compared to uncorrelated variability (J). Error bars are two standard errors. n is the number of embryos; N is the number of independent experiments. See also Tables S1–S3.