
- Title
-
Photosubstitution in a trisheteroleptic ruthenium complex inhibits conjunctival melanoma growth in a zebrafish orthotopic xenograft model
- Authors
- Chen, Q., Cuello-Garibo, J.A., Bretin, L., Zhang, L., Ramu, V., Aydar, Y., Batsiun, Y., Bronkhorst, S., Husiev, Y., Beztsinna, N., Chen, L., Zhou, X.Q., Schmidt, C., Ott, I., Jager, M.J., Brouwer, A.M., Snaar-Jagalska, B.E., Bonnet, S.
- Source
- Full text @ Chem Sci

Activation mechanism of the ruthenium-based PACT compound [2]2+. Upon green light irradiation, the protecting, non-toxic mtmp ligand is photosubstituted by solvent molecules, which recovers the biomolecule-binding ability of the heavy metal centre, ultimately leading to cytotoxicity and cell death. |
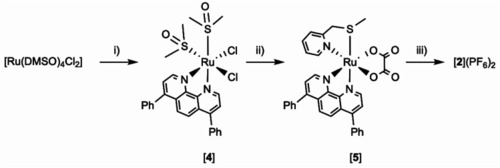
Synthesis of tris-heteroleptic compound [Ru(dpp)(bpy)(mtmp)](PF6)2 ([2](PF6)2). Conditions: (i) 1.0 eq. dpp, EtOH, reflux 2 h, Y = 51%. (ii) (a) 1.5 eq. Na2C2O4; water, reflux 1 h; (b) 1.0 eq. mtmp, ethylene glycol, reflux 3 h; (c) water; Y = 71%. (iii) (a) 1 M HClO4(aq)/CH3CN 1 : 1, reflux 1 h, (b) 1.0 eq. bpy, ethylene glycol, 100 °C, 6 h; (3) aqueous KPF6; Y = 28%. |

Evolution of the UV-vis spectrum of an acetonitrile solution of [2](PF6)2 (36 μM) upon green light irradiation (521 nm, 14 mW cm−2, photon flux 6.2 × 10⁻⁸ mol s−1) under inert atmosphere. Insert: black and red dots represent the evolution of the absorbance at 460 nm and 430 nm, respectively (dashed lines in the spectrum), vs. irradiation time. |

Dose–response curves for A549 cells treated with [2](PF6)2 24 h after seeding, and irradiated with green light (520 nm, 15 min, 21 mW cm−2, 19 J cm−2) 24 h after treatment (green data points) or left in the dark (black data points). (a) A549 cells were cultured in 2D cell monolayers. SRB end-point assay was carried out at 48 h after irradiation (light) or 72 h after compound addition (dark). (b) A549 cells were cultured as 3D multicellular tumour spheroids in ultra-low attachment flask. The spheroids were treated with [2](PF6)2 at day 4, irradiated at day 5 (520 nm, 15 min, 21 mW cm−2, 19 J cm−2), and their viability assayed at day 7 by a CellTiter-Glo 3D cell viability assay. Results are presented as means ± SD from three independent experiments. |
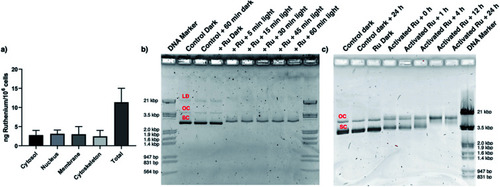
[2](PF6)2 is present in the nucleus and interacts with DNA. (a) Sub-cellular distribution of ruthenium in the cytosol, nucleus, membrane, and cytoskeleton fraction of A549 cells 24 h after treatment with [2](PF6)2 (33 μM), according to ICP-MS. (b) Photo-induced binding of [2](PF6)2 to pUC19 plasmid DNA. The DNA molecular weight marker (lanes 1 & 10) correlate to 564 bp, 831 bp, 947 bp, 1.4 kbp, 1.6 kbp, 1.9 kbp, 2.0 kbp, 3.5 kbp and 21 kbp. The control pUC19 DNA band (dark) shows three bands corresponding to the linear dimer (LD), open circular (OC), and supercoiled (SC) forms. Lane 2–3 corresponds to pUC19 (control) and pUC19 incubated for 60 min in the dark. Lanes 4–9 correspond to pUC19 treated with [2](PF6)2 (40 μM) and irradiated with green light (520 nm, 21 mW cm−2) for 0 (dark), 5, 15, 30, 45, or 60 min. (c) Effect of dark incubation time on pUC19 plasmid treated with light-activated [2](PF6)2 (40 μM). The initial irradiation time was 15 min (21 mW cm−2, 19 J cm−2, 520 nm). Lanes 1–2 correspond to pUC19 (control) and pUC19 incubated for 24 h in the dark. Lane 3 corresponds to pUC19 + [2](PF6)2 without light activation. Lanes 4–8 correspond to pUC19 + [2](PF6)2 + light, followed by dark incubation times of 0, 1, 4, 12, or 24 h. Lane 9 is DNA molecular weight marker. |

Apoptosis-associated proteins and DNA fragmentation in CRMM1 cells treated with [2](PF6)2. (a) Western blot showing native PARP, cleaved PARP, pro-caspase-3, cleaved caspase-3 and β-actin as loading control in CRMM1 cells treated with [2](PF6)2 at EC50,light (4 μM) for 24 h, irradiated or not with green light (520 nm, 15 min, 21 mW cm−2, 19 J cm−2), and further incubated for 48 h in the dark. (b) DNA fragmentation in CRMM1 cells treated with [2](PF6)2 at EC50,light (4 μM) for 24 h, irradiated or not with green light (520 nm, 15 min, 21 mW cm−2, 19 J cm−2), and incubated in the dark for 4 h or 24 h after light irradiation. |
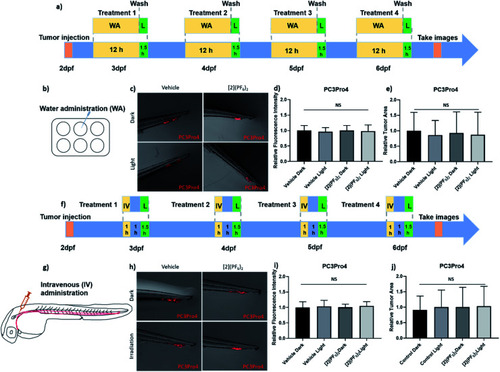
Efficacy of [2](PF6)2 in PC3Pro4 prostate cancer zebrafish ectopic model. (a) Schedule of tumour cells injection and treatment with [2](PF6)2 by water administration (WA). Around 300 PC3Pro4 cells were injected into Duct of Cuvier at 2 dpf. 0.5 μM of [2](PF6)2 was added into water at 2.5, 3.5, 4.5, 5.5 dpf. At 3, 4, 5, 6 dpf, the compound was washed away, the embryos were irradiated with green light (21 mW cm−2, 90 min, 114 J cm−2, 520 nm). (b) Water administration of [2](PF6)2 into 6-well plates containing engrafted embryos. (c) The images of PC3Pro4 tumour burden at CHT site at 6 dpf. (d) The relative fluorescence intensity of PC3Pro4 tumour burden at 6 dpf. (e) The relative tumour area of PC3Pro4 tumour burden at 6 dpf schedule of tumour cells injections and treatment with 200 μM of [2](PF6)2 by intravenous administration. (g) The injection site of intravenous administration (IV). (h) The images of PC3Pro4 tumour burden at CHT site at 6 dpf. (i) The relative fluorescence intensity of PC3Pro4 tumour burden at 6 dpf. (j) The relative tumour area of PC3Pro4 tumour burden at 6 dpf. Results are presented as means ± SD from three independent experiments. |

Efficacy of the PACT compound [2](PF6)2 in the Tg(Fli:GFP/casper) zebrafish orthotopic model of conjunctival melanoma (CRMM1 and CRMM2 cell lines) by retro-orbital administration (RO). (a) Scheme showing the injection site of retro-orbital administration. (b) Time flow of [2](PF6)2 treatment with RO administration. Around 200 CRMM1 or CRMM2 cells were injected into the RO site of zebrafish embryos at 2 dpf. [2](PF6)2 was injected into RO site at 3, 4, 5, 6 dpf, and after 1 h drug-light interval, the embryos were irradiated with green light (520 nm, 21 mW cm−2, 90 min, 114 J cm−2). (c) The images of CRMM1 or CRMM2 tumour burden (in red) at CHT site at 6 dpf. Green represents vessels in zebrafish embryos. (d and g) The relative red fluorescence (excitation: 554 nm, emission: 581 nm) intensity of CRMM1 or CRMM2 tumour burden at 6 dpf. (e and h) The relative tumour area (pixel2) of CRMM1 or CRMM2 tumour burden at 6 dpf. Results are presented as means ± SD from three independent experiments. ****P < 0.0001. |
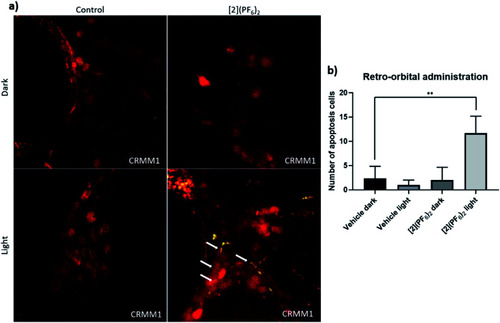
TUNEL assay in the CRMM1 orthotopic tumour model after RO injection of [2](PF6)2. (a) Red fluorescent CRMM1 cells were injected behind the eye of the embryo at 2 dpf, and the embryos were divided into four groups for drug treatment. RO administration of vehicle control and [Fig. 8. After dark or light exposure, embryos were fixed and TUNEL staining was performed. (a) Representative overlay images of embryos are shown. In the group treated with [2](PF6)2 and light, nuclear DNA fragmentation in nucleases is detected by co-localization of green (DNA fragments) and red (CM tumour cell) signal, depicted on the overlay as yellow signal marked by white arrows. In the dark control group, light control group, and group treated with [2](PF6)2 and left in the dark, there were no positive green apoptotic tumour cells. The background green signal in the [2](PF6)2 light groups did not co-localize with cytosolic red signal, which is diminished in degraded cells and TUNEL stains only the DNA breaks in these CM apoptotic cells. (b) Quantification of the number of apoptotic tumour cells (yellow dots). Experiment was performed 3 times with a group size of 10 embryos. **P < 0.01. |