
- Title
-
An adult zebrafish model for adherent-invasive Escherichia coli indicates protection from AIEC infection by probiotic E. coli Nissle
- Authors
- Nag, D., Farr, D., Raychaudhuri, S., Withey, J.H.
- Source
- Full text @ iScience

Colonization of AIEC in zebrafish intestines (A) Fish were added to 400 mL water containing 5×10³, 5×10⁴, 5×10⁵, or 5 × 10⁶ CFU/mL of AIEC cells for 6 h and then incubated in fresh, sterile water for 18 h. Data are represented as mean +/− SEM from multiple experiments. Each dot represents the data from one fish. Total colonization per intestine was calculated after plating serial dilutions of intestinal homogenates 24 h postinfection. Statistical significance indicated above the data was determined by Student’s t test. ∗p = 0.0442, ∗∗p = 0.0034, and ∗∗∗p = 0.0002. (B) Representative H&E staining (5X) of zebrafish intestinal sections. Villus structures in zebrafish having different AIEC doses were compared with uninfected control zebrafish. The H&E figures are representative of three independent experiments. (C) Fluorescent microscopy of mCherry-AIEC infection of WT zebrafish intestinal epithelium. Fish were exposed to 5 × 10⁶ CFU/mL of mCherry-AIEC for 6 h, moved to fresh water for 18 h, then sacrificed, fixed, and prepared for sectioning. Bacteria were visualized (Red) by expressing mCherry on the pPrps plasmid. Blue fluorescence (DAPI) represents intestinal epithelial cell nuclei. Magnification 40X. The fluorescent figures are representative of three independent experiments. An uninfected control fish is shown in the upper panel to verify there was no significant autofluorescence in zebrafish gut (no DAPI staining). |
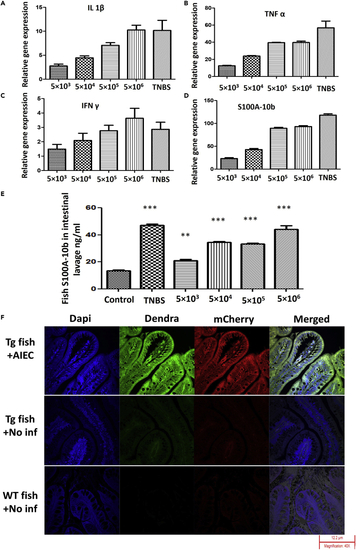
Inflammation induced by AIEC in zebrafish (A–D) WT zebrafish were infected with AIEC at 5×10³, 5×10⁴, 5×10⁵, or 5 × 10⁶ CFU/mL for 6 h, moved to fresh water for 18 h, and then sacrificed. mRNA was isolated from intestinal tissue. Relative gene expression levels of TNFα (A), s100a-10b (B), IFNγ (C), and IL-1β (D) were determined by qRT-PCR. Gene expression was normalized against β-actin and expressed as fold change. TNBS, a positive stimulator of inflammatory markers, was used as a positive control. Error bars indicate standard deviation. Data are represented as mean +/− SEM from three experiments. (E) S100A-10b (calprotectin) protein levels were determined in intestinal homogenate via ELISA. Error bars indicate standard deviation. TNBS, a positive stimulator of inflammatory markers, was used as a positive control. Data are represented as mean +/− SEM from three experiments. ∗∗p < 0.005 and ∗∗∗p < 0.0005 as compared with control. (F) Fluorescent microscopy of neutrophil response to AIEC infection of transgenic (mpx:dendra) zebrafish intestinal epithelium. Fish were exposed to 5 × 10⁶ CFU/mL of AIEC for 6 h, moved to fresh water for 18 h, then sacrificed, fixed, and prepared for sectioning. Bacteria were visualized (Red) by expressing mCherry from the pPrps plasmid; blue fluorescence (DAPI) represents intestinal epithelial cell nuclei (bottom row: no DAPI staining and the merged figure contains white background), and green fluorescence (Dendra) represents neutrophils. Magnification 40X. The fluorescent figures are representative of three independent experiments. |
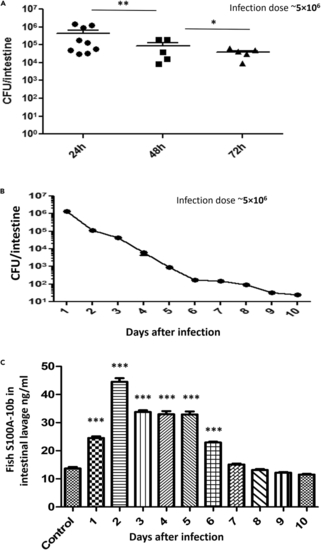
Long-term AIEC infection in zebrafish (A) Fish were added to 400 mL water containing 5 × 10⁶ CFU/mL of AIEC for 6 h and then moved to fresh water for 18 h (24 hpi), 42 h (48 hpi), or 66 h (72 hpi). Data are represented as mean +/− SEM from multiple experiments. Each dot represents the data from one fish. Total colonization per intestine was calculated by plating serial dilutions of intestinal homogenates 24 h postinfection. Statistical significance indicated above the data was determined by Student’s t test. ∗p = 0.0105 and ∗∗p = 0.0036. (B) Fish were added to 400 mL water containing 5 × 10⁶ CFU/mL of AIEC for 6 h and then moved to fresh water for up to 10 days with daily water changes. Three fish were sacrificed per day. The graph is the presentation of the decreasing colonization of AIEC in zebrafish intestine with subsequent days. Error bars indicate standard deviation. Data shown are from three experiments. (C) S100A-10b protein levels were determined in intestinal homogenates by calprotectin ELISA. Days after infection were plotted in the x axis. Error bars indicate standard deviation. Data are represented as mean +/− SEM from three experiments. ∗∗∗p ≤ 0.0001 compared with control. |
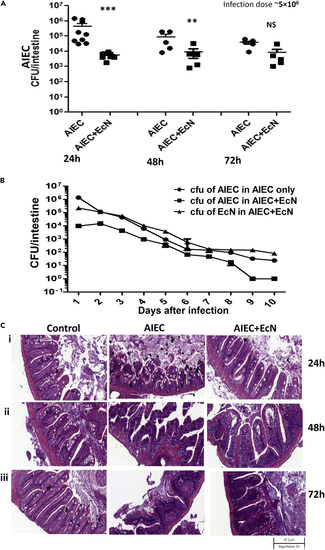
Effects of EcN on AIEC colonization (A) Fish were added to 400 mL water containing 5 × 10⁶ CFU/mL of only AIEC or 1:1 combination of AIEC and EcN for 6 h and then moved to fresh water for 18 h (24 hpi), 42 h (48 hpi), or 66 h (72 hpi). AIEC colonization in zebrafish intestine is shown on the y axis and is compiled from multiple experiments. Data are represented as mean +/− SEM from multiple experiments. Each dot represents the data from one fish. Total colonization per intestine was calculated after plating serial dilutions of intestinal homogenates 24 h postinfection. Statistical significance indicated above the data was determined by Student’s t test. ∗∗∗p < 0.0001, ∗∗p = 0.0019, and NS = nonsignificant. (B) Fish were added to 400 mL water containing 5 × 10⁶ CFU/mL of only AIEC or 1:1 combination of AIEC and EcN for 6 h and then moved to fresh water for up to 10 days with daily water changes. Three fish were sacrificed per day. The graph illustrates the significant decrease in AIEC colonization in AIEC and EcN (1:1) co-infected zebrafish compared with AIEC-infected zebrafish. The graph also illustrates successful EcN colonization in the zebrafish intestine over time. Error bars indicate standard deviation. Data shown are from three experiments. (C) Representative H&E staining (5X) of zebrafish intestinal sections. Villus structure in AIEC-only and AIEC and EcN (1:1)-infected zebrafish were compared with the control zebrafish 24 hpi (i), 48 hpi (ii), and 72 hpi (iii). The H&E figures are representative of three independent experiments. |

Effect of EcN on AIEC-induced inflammation (A–D) WT zebrafish were infected with 5 × 10⁶ CFU/mL AIEC and simultaneously inoculated with EcN for 6 h and then moved to fresh water for 18 h (24 hpi) (A), 42 h (48 hpi), (B) or 66 h (72 hpi) (C) and then sacrificed. mRNA was isolated from intestinal tissue. Relative gene expression levels of TNFα (A), s100a-10b (B), IFNγ (C), and IL-1β (D) were determined by qRT-PCR. Gene expression was normalized against β-actin and expressed as fold change. Error bars indicate standard deviation. Data are represented as mean +/− SEM from three experiments. ∗∗∗p < 0.0005, ∗∗p < 0.005, and ∗p < 0.05 as compared between AIEC and AIEC and EcN. (D) S100A-10b protein levels were determined in intestinal homogenates by calprotectin ELISA. Error bars indicate standard deviation. TNBS, a positive stimulator of inflammatory markers, was used as a positive control. Data are represented as mean +/– SEM from three experiments. ∗∗∗p = 0.0006, ∗∗p = 0.0025, and ∗p = 0.0412 compared between AIEC and AIEC and EcN. |
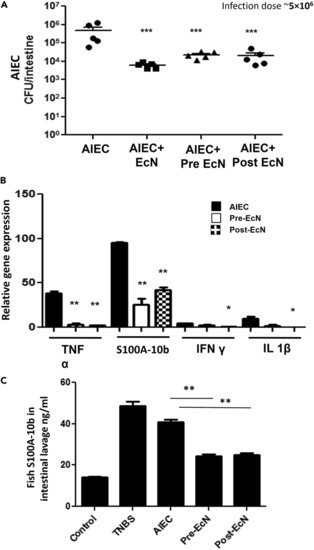
Prophylactic and therapeutic effects of EcN on AIEC infection (A) Fish were added to 400 mL water containing 5 × 10⁶ CFU/mL of only AIEC or a 1:1 combination of AIEC and EcN cells for 6 h and then moved to fresh water for 18 h, or fish were added to 400 mL water containing 5 × 10⁶ CFU/mL of EcN for 6 h followed by 5 × 10⁶ CFU/mL of AIEC (pre-EcN, prophylactic) for 6 h and vice versa, i.e., AIEC first, then EcN (post-EcN, therapeutic), and then incubated in fresh water for 12 h. AIEC colonization in zebrafish intestine is shown on the y axis and is compiled from multiple experiments. Data are represented as mean +/– SEM from multiple experiments. Each dot represents the data from one fish. Total colonization per intestine was calculated after plating serial dilutions of intestinal homogenates 24 h postinfection. Statistical significance indicated above the data was determined by Student’s t test. ∗∗∗p < 0.0005 compared with only AIEC infection. (B) Zebrafish were infected with 5 × 10⁶ CFU/mL of only AIEC, pre-EcN then AIEC (prophylactic), or AIEC then post-EcN (therapeutic) as mentioned and were sacrificed 24 hpi. mRNA was isolated from intestinal tissue. Relative gene expression levels of TNFα, s100a-10b, IFNγ, and IL-1β were determined through qRT-PCR. Gene expression was normalized against β-actin and expressed as fold change. Error bars indicate standard deviation. Data are represented as mean +/– SEM from three experiments. ∗∗p < 0.005 and ∗p < 0.05 as compared with only AIEC infection. (C) S100A-10b protein levels were determined in intestinal homogenates by calprotectin ELISA. Error bars indicate standard deviation. TNBS, a positive stimulator of inflammatory markers, was used as a positive control. Data are represented as mean +/− SEM from three experiments. ∗∗p < 0.005 compared with the only AIEC infection. |
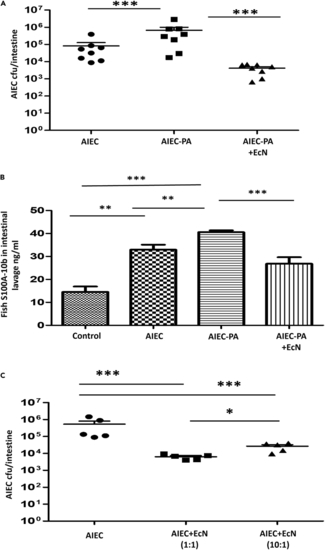
EcN protects against hyperinfective AIEC (A) Fish were added to 400 mL water containing 5 × 10⁶ CFU/mL of only AIEC, PA-primed AIEC (AIEC grown overnight in LB with 20 nM propionic acid) or a 1:1 combination of PA-primed AIEC and EcN cells for 6 h and then moved to sterile fresh water for 18 h. AIEC colonization in zebrafish intestine is shown on the y axis and is compiled from multiple experiments. Data are represented as mean +/− SEM from multiple experiments. Each dot represents the data from one fish. Total colonization per intestine was calculated after plating serial dilutions of intestinal homogenates 24 h postinfection. Statistical significance indicated above the data was determined by Student’s t test. ∗∗∗p < 0.0001. (B) S100A-10b protein levels were determined in intestinal homogenate via calprotectin ELISA. Error bars indicate standard deviation. Data are represented as mean +/− SEM from three experiments. ∗∗p < 0.005 and ∗∗∗p < 0.0001. (C) Fish were added to 400 mL water containing 5 × 10⁶ CFU/mL of only AIEC, 1:1 and 10:1 combination of AIEC and EcN cells for 6 h, and then incubated in fresh water for 18 h. AIEC colonization in zebrafish intestine is shown on the y axis and compiled from multiple experiments. Data are represented as mean +/− SEM from multiple experiments. Each dot represents the data from one fish. Total colonization per intestine was calculated after plating serial dilutions of intestinal homogenates 24 h postinfection. Statistical significance indicated above the data was determined by Student’s t test. ∗∗∗p < 0.0001 and ∗p = 0.0109. |