
|
Fig. 3
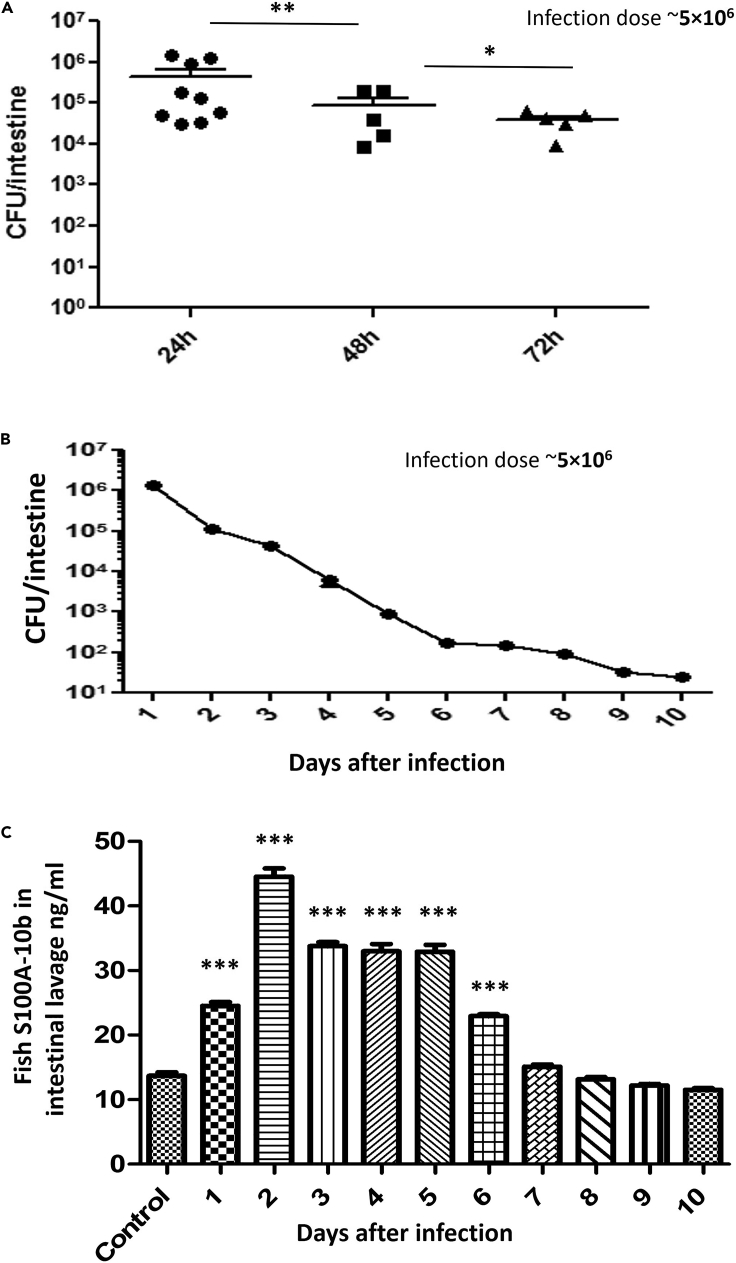
Long-term AIEC infection in zebrafish
(A) Fish were added to 400 mL water containing 5 × 10⁶ CFU/mL of AIEC for 6 h and then moved to fresh water for 18 h (24 hpi), 42 h (48 hpi), or 66 h (72 hpi). Data are represented as mean +/− SEM from multiple experiments. Each dot represents the data from one fish. Total colonization per intestine was calculated by plating serial dilutions of intestinal homogenates 24 h postinfection. Statistical significance indicated above the data was determined by Student’s t test. ∗p = 0.0105 and ∗∗p = 0.0036.
(B) Fish were added to 400 mL water containing 5 × 10⁶ CFU/mL of AIEC for 6 h and then moved to fresh water for up to 10 days with daily water changes. Three fish were sacrificed per day. The graph is the presentation of the decreasing colonization of AIEC in zebrafish intestine with subsequent days. Error bars indicate standard deviation. Data shown are from three experiments.
(C) S100A-10b protein levels were determined in intestinal homogenates by calprotectin ELISA. Days after infection were plotted in the x axis. Error bars indicate standard deviation. Data are represented as mean +/− SEM from three experiments. ∗∗∗p ≤ 0.0001 compared with control.