
|
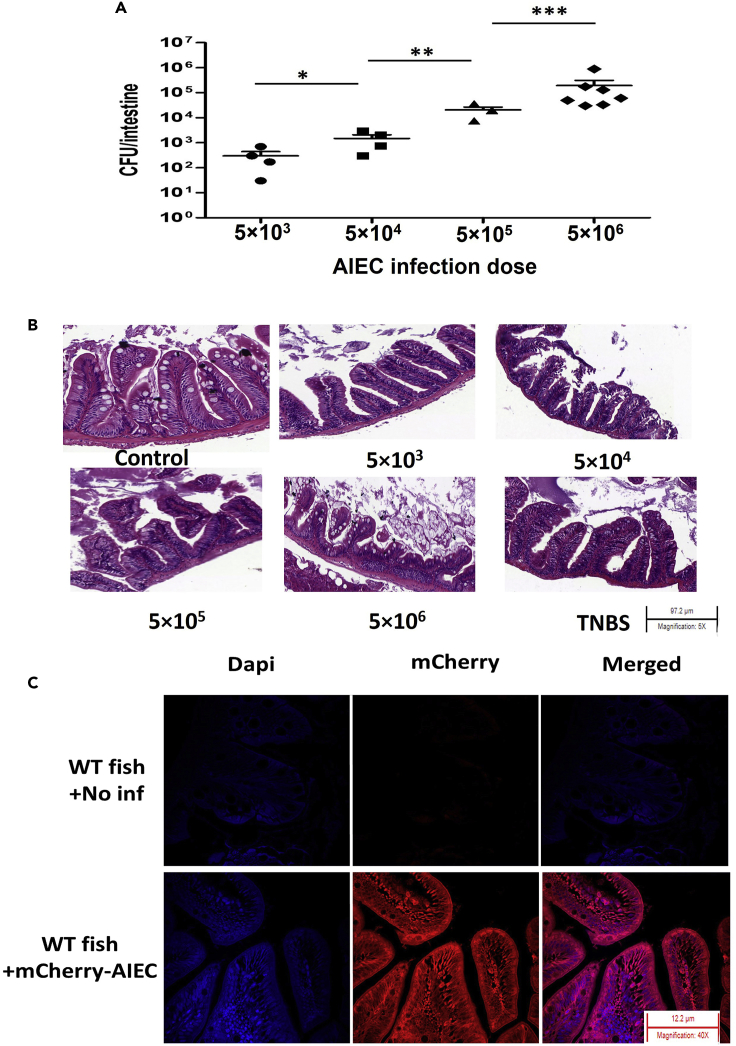
Fig. 1
Colonization of AIEC in zebrafish intestines
(A) Fish were added to 400 mL water containing 5×10³, 5×10⁴, 5×10⁵, or 5 × 10⁶ CFU/mL of AIEC cells for 6 h and then incubated in fresh, sterile water for 18 h. Data are represented as mean +/− SEM from multiple experiments. Each dot represents the data from one fish. Total colonization per intestine was calculated after plating serial dilutions of intestinal homogenates 24 h postinfection. Statistical significance indicated above the data was determined by Student’s t test. ∗p = 0.0442, ∗∗p = 0.0034, and ∗∗∗p = 0.0002.
(B) Representative H&E staining (5X) of zebrafish intestinal sections. Villus structures in zebrafish having different AIEC doses were compared with uninfected control zebrafish. The H&E figures are representative of three independent experiments.
(C) Fluorescent microscopy of mCherry-AIEC infection of WT zebrafish intestinal epithelium. Fish were exposed to 5 × 10⁶ CFU/mL of mCherry-AIEC for 6 h, moved to fresh water for 18 h, then sacrificed, fixed, and prepared for sectioning. Bacteria were visualized (Red) by expressing mCherry on the pPrps plasmid. Blue fluorescence (DAPI) represents intestinal epithelial cell nuclei. Magnification 40X. The fluorescent figures are representative of three independent experiments. An uninfected control fish is shown in the upper panel to verify there was no significant autofluorescence in zebrafish gut (no DAPI staining).