
- Title
-
Zebrafish Xenograft Model for Studying Pancreatic Cancer-Instructed Innate Immune Microenvironment
- Authors
- Wang, X., Li, W., Jiang, H., Ma, C., Huang, M., Wei, X., Wang, W., Jing, L.
- Source
- Full text @ Int. J. Mol. Sci.

The pancreatic cancer cells show differential engraftment profile in zebrafish. (A) The growth curve of in-vitro cultured PANC1, BxPC3, and AsPC1 cells. (B) Representative confocal images of PANC1, BxPC1, and AsPC1 xenografts at 1 dpi and 4 dpi. (C) Engraftment quantification for PANC1, BxPC1, and AsPC1 cells at 4 dpi. Results are shown as means ± SEM from 50 different individuals. (D) Relative tumor growth (4 dpi vs. 1 dpi) for PANC1, BxPC3, and AsPC1 xenografts. Results are from nine different individuals (*** p < 0.001, **** p < 0.0001, t test). (E) PANC1 and AsPC1 showed metastasis in the intestine (white arrowheads) and in the caudal hematopoietic tissue (white arrows). (F) Representative confocal images of PANC1, BxPC3, and AsPC1 xenografts at 1 dpi or at 4 dpi after DMSO (control), irinotecan (50 μM) or 5-Fu (2 mM) treatment. (G) Relative tumor growth (4 dpi vs. 1 dpi) for PANC1, BxPC3, and AsPC1 xenografts after treatment with DMSO, irinotecan or 5-Fu. Results are from nine different individuals (* p < 0.05, ** p < 0.01, ***p < 0.001, **** p < 0.0001, t test). dpi, days post injection. Scale bars in (B,F), 50 µm; in (E), 75 µm. |
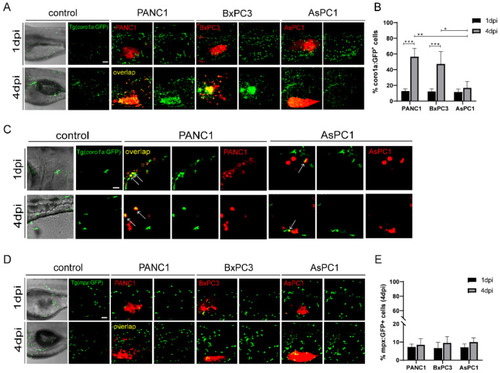
The pancreatic cancer cells show distinct interaction with the innate immune cells in zebrafish. (A) Representative confocal images of Tg(coro1a: GFP)-labeled innate immune cells in PANC1, BxPC3, and AsPC1 xenografts at 1 dpi and 4 dpi. (B) Qualification of innate immune cell percentage in PANC1, BxPC3, and AsPC1 cells at 1 dpi and 4 dpi (no. of innate immune cells/no. of tumor cells × 100). Results are shown as means ± SEM from nine different individuals (* p < 0.05, ** p < 0.01, *** p < 0.001, ANOVA). (C) Enlarged confocal images of innate immune cells co-localized with PANC1 and AsPC1 xenografts at 1 dpi and 4 dpi. Arrows point to the co-localized cells. (D) Representative confocal images of Tg(mpx: GFP)-labeled neutrophils in PANC1, BxPC3, and AsPC1 xenografts at 1 dpi and 4 dpi. (E) Qualification of neutrophils percentage in PANC1, BxPC3, and AsPC1 cells at 1 dpi and 4 dpi (no. of neutrophils/no. of tumor cells × 100). Results are from nine different individuals. dpi, days post injection. Scale bars in (A,D), 50 µm; in (C), 25 µm. |

PANC1, BxPC3, and AsPC1 cells induce anti-tumoral or pro-tumoral state of innate immune cells. (A) The relative expression of TNF-α, IL-12, and IL-10 in coro1a: GFP+ cells sorted from PANC1, BxPC3, and AsPC1 xenografts (* p < 0.05, t test). (B) Representative confocal images of innate immune cells in PANC1, BxPC3, and AsPC1 xenografts at 4 dpi after treatment with DMSO (control) or LPS (150 μg/mL). (C) Qualification of coro1a: GFP+ innate immune cell percentage in PANC1, BxPC3, and AsPC1 cells at 4 dpi under the control and LPS condition (no. of innate immune cells/no. of tumor cells × 100). Results are shown as means ± SEM from nine different individuals (** p < 0.01, t test). (D) Enlarged confocal images of innate immune cells co-localized with PANC1 and AsPC1 cells at 4 dpi under the control or LPS treatment. Arrowheads point to the co-localized cells. (E) Representative confocal images of PANC1, BxPC3, and AsPC1 xenografts at 1 dpi and 4 dpi with the treatment of DMSO (control) or LPS (150 μg/mL) respectively. (F) Relative tumor growth in xenografts (4 dpi vs. 1 dpi) after being treated with DMSO or LPS. Results are from nine different individuals (* p < 0.05, ** p < 0.01, *** p < 0.001, t test). dpi, days post injection. Scale bars in (B,E), 50 µm; in (D), 25 µm. |
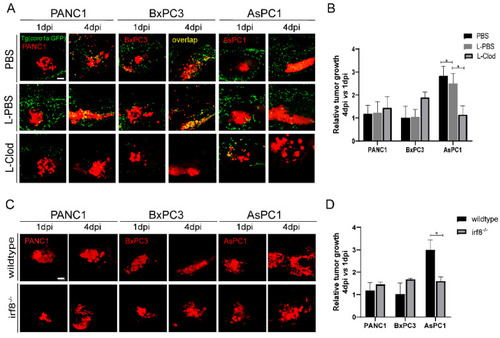
Zebrafish innate immune cells regulate PANC1, BxPC3, and AsPC1 tumor progression. (A) Representative confocal images of PANC1, BxPC3, and AsPC1 xenografts in embryos co-injected with PBS, L-PBS or liposome-clodronate (L-clodronate) at 1 dpi and 4 dpi. (B) Relative tumor cell growth for PANC1, BxPC3, and AsPC1 in PBS, L-PBS, or L-clodronate-treated groups. Results are from nine different individuals (* p < 0.05, t test). (C) Representative confocal images of PANC1, BxPC3, and AsPC1 xenografts in WT and irf8−/− mutant embryos at 1 dpi and 4 dpi. (D) Relative tumor growth of PANC1, BxPC3, and AsPC1 in WT and irf8−/− mutant embryos. Results are shown as means ± SEM from nine different individuals (* p < 0.05, t test). dpi, days post injection. Scale bar, 50 µm. |
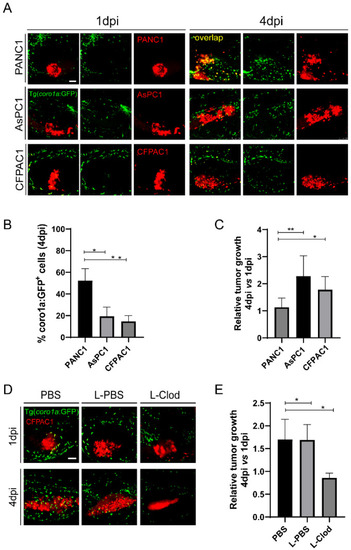
CFPAC1 also hijacks innate immune cells to promote tumor growth in zebrafish. (A) Representative confocal images of PANC1, AsPC1, and CFPAC1 xenografts at 1 dpi and 4 dpi. (B) Qualification of coro1a: GFP+ innate immune cell percentage in PANC1, AsPC1, and CFPAC1 cells at 4 dpi (no. of innate immune cells/no. of tumor cells × 100). Results are shown as means ± SEM from nine different individuals (* p < 0.05, ** p < 0.01, t test). (C) Relative tumor growth of PANC1, AsPC1, and CFPAC1. Results are from nine different individuals (* p < 0.05, ** p < 0.01, t test). (D) Representative confocal images of CFPAC1 xenografts in the embryos co-injected with PBS, L-PBS or liposome-clodronate (L-clodronate) at 1 dpi and 4 dpi. (E) Relative tumor growth of CFPAC1 in PBS-, L-PBS- or L-clodronate-treated groups. Results are from nine different individuals (* p < 0.05, t test). dpi, days post injection. Scale bar, 50 µm. |

Knockdown of REG4 in cancer cells suppresses tumor growth and activates innate immune response in zebrafish. (A) Relative expression of REG4 mRNA in PANC1, BxPC3, AsPC1, and CFPAC1 cells. (B) Western Blotting of REG4 and Actin in PANC1 and AsPC1 cells transfected with the control or REG4 siRNA. (C) The growth curve of in-vitro culture of PANC1 and AsPC1 cells transfected with the control or REG4 siRNA. (D) Representative confocal images of PANC1 and AsPC1 cells transfected with the control or REG4 siRNA in zebrafish xenografts at 4 dpi. (E) Relative tumor growth (4 dpi vs. 1 dpi) of the control tumor cells or cells with REG4 silencing. Results are shown as means ± SEM from nine different individuals (*** p < 0.001, t test). (F) Representative confocal images of ASPC1 cells in the control or REG4-silencing group in Tg(coro1a: GFP+) zebrafish. (G) Quantification coro1a: GFP+ innate immune cell percentage in AsPC1 tumor in the control and REG4-silencing groups. Results are from nine different individuals (* p < 0.05, t test). dpi, days post injection. Scale bars, 50 µm. |