
- Title
-
Vision-related convergent gene losses reveal SERPINE3's unknown role in the eye
- Authors
- Indrischek, H., Hammer, J., Machate, A., Hecker, N., Kirilenko, B., Roscito, J., Hans, S., Norden, C., Brand, M., Hiller, M.
- Source
- Full text @ Elife
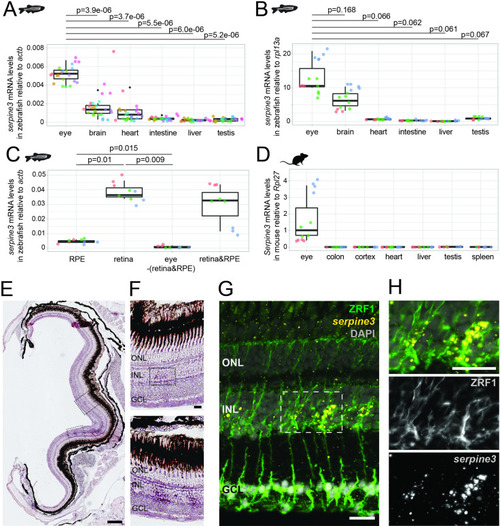
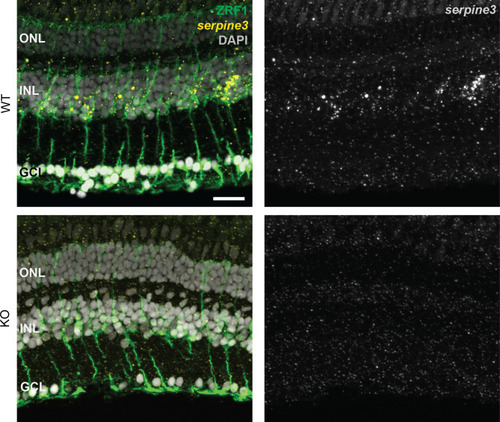
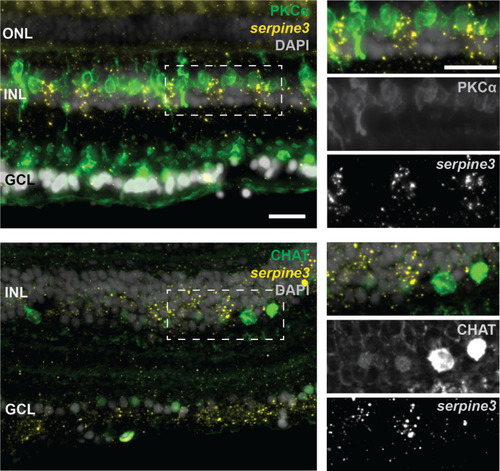
(A,B) Expression of zebrafish serpine3 mRNA in relation to the normalization genes actb (A) and rpl13a (B) measured with RT-qPCR. Expression levels are consistently the highest in eye. A two-sided unequal variances t-test was used. Boxplots display first quartile, median and third quartile with whiskers extending to the maximum and minimum value. Measurements of technical replicates (n=3–6) are encoded in the same color, different colors represent different biological replicates (n=3–8). Relative rates are displayed as zero, if expression was below the detection limit. (C) Serpine3 mRNA expression in different tissues of the zebrafish eye in relation to the reference gene actb measured with RT-qPCR for three biological replicates. Serpine3 is specifically expressed in the retina but not in other tissues of the eye. The expression level is significantly higher in retina without RPE compared to RPE only (two-sided unequal variances t-test). Although expression in RPE only is low, it is significantly higher than expression in eye tissue after removing retina and RPE (two-sided unequal variances t-test). (D) Serpine3 mRNA expression in mouse in relation to the reference gene Rpl27 measured with RT-qPCR for three biological replicates. Serpine3 is specifically expressed in the eye but not in colon, cortex, heart, liver, spleen and testis. (E–H) Serpine3 mRNA expression pattern in zebrafish retina. (E–F) Chromogenic in situ hybridization (ISH) shows localized expression of serpine3 (purple) in the retina, specifically in the inner nuclear layer (inlet). (G–H) Fluorescence in situ hybridization shows that serpine3 mRNA expression (yellow) is localized to cell bodies of Müller glia cells. Filaments of Müller glia cells are marked by the glial fibrillary acidic protein (ZRF1 antibody, green). Specificity of the serpine3 ISH probe is shown by absence of the signal in homozygous serpine3cbg17 knockout fish (Figure 3—figure supplement 1). Serpine3 mRNA is not expressed in bipolar or amacrine cells (Figure 3—figure supplement 2). Nuclei are stained with DAPI (white). Scale bar is 200 µm in (E) and (G) and 20 µm in (F) and (H). INL – inner nuclear layer, ONL – outer nuclear layer, GCL – ganglion cell layer.
|
The fluorescence in situ signal for zebrafish |
Fluorescence in situ hybridization of EXPRESSION / LABELING:
|
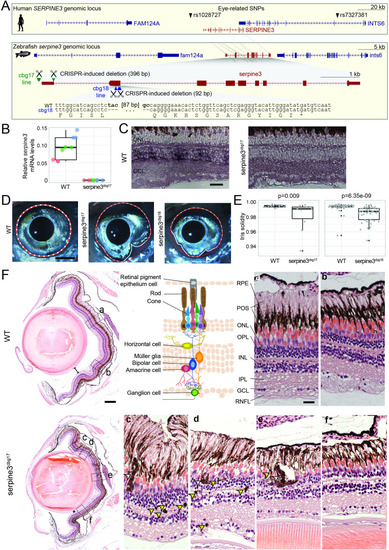
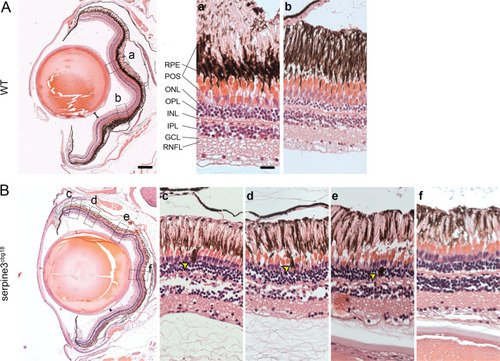
(A) UCSC genome browser visualization of the SERPINE3 genomic locus in human (hg38 assembly, top box) and zebrafish (danRer11 assembly, bottom box) shows that both species have a 1:1 ortholog with the same number of coding exons in a conserved gene order context. In the human locus, two single nucleotide polymorphisms (SNPs) are in linkage with SERPINE3 and associated with eye phenotypes. In zebrafish, we used CRISPR-Cas9 to generate two independent knockout (KO) lines. The position of guide RNAs is indicated as scissors. In the serpine3cbg17 line, we deleted the promoter and first exon. In the serpine3cbg18 line, we introduced a 92 bp frame-shifting deletion in exon 2 (coding exon 1) that results in three early stop codons in the original reading frame. (B) Relative expression of serpine3 mRNA in wild type (WT) zebrafish and serpine3cbg17 individuals quantified by RT-qPCR relative to the expression of rpl13a. Serpine3 mRNA expression is close to zero in serpine3cbg17 fish and significantly reduced in comparison to wild type fish (p=0.049, two-sided unequal variances t-test). Technical replicates of the qPCR are shown as individual data points; different colors represent different biological replicates. Boxplots display first quartile, median and third quartile with whiskers extending to the maximum and minimum of the three biological replicates. (C) In situ hybridization showing that serpine3 is expressed in the inner nuclear layer (INL) of WT zebrafish but not in the homozygous serpine3cbg17. Scale bar = 25 µm. (D) Serpine3 knockout leads to changes in eye shape in adult, homozygous knockout (KO) fish of serpine3cbg17 and serpine3cbg18 lines in comparison to their WT siblings (18 and 11 months, respectively). In WT, the eye shape almost perfectly corresponds to the concave shape of the iris (overlay of white and red dotted lines). In contrast, many KO individuals have alterations in eye shape, evident by notches (arrow heads) in the white line that follows the iris. Scale bar = 1 mm. (E) Iris solidity (ratio of eye shape/ concave eye shape) significantly differs between WT and KO siblings for both the serpine3cbg17 (16 vs 10 eyes) and the serpine3cbg18 (40 vs 40 eyes) line. A Wilcoxon Rank sum test was used. Boxplots display first quartile, median, and third quartile with whiskers extending to the maximum and minimum within 1.5 times interquartile range. Outliers are shown in black. Iris circularity, another quantification measure for the phenotype, is shown in Figure 4—figure supplement 3. (F) Hematoxylin/eosin histology staining of the eye of serpine3cbg17 fish (22 months) reveals histological differences in comparison to their WT siblings (dorsal top, ventral bottom). In comparison to WT, distance between lens and retina of serpine3cbg17 fish is reduced (distance bars). The WT retina (top) has a distinct lamination with clear separation of the single retinal layers (a, b) as shown in the schematic (RPE – retinal pigment epithelium layer, POS – photoreceptor outer segment, ONL – outer nuclear layer, OPL – outer plexiform layer, INL – inner nuclear layer, IPL – inner plexiform layer, GCL – ganglion cell layer, RNFL – retinal nerve fiber layer). Although all retinal layers are present in serpine3cbg17 fish, the layering appears distorted and the density of cells is reduced (c–f). Specifically, the RPE cells display an altered distribution and even local clusters (empty arrows), and displaced pigmented cells emerge in all retinal layers (yellow arrows). This was confirmed also for the cbg18 allele (Figure 4—figure supplement 5). Scale bar in the overviews = 200 µm, scale bar in the magnifications = 20 µm.
|
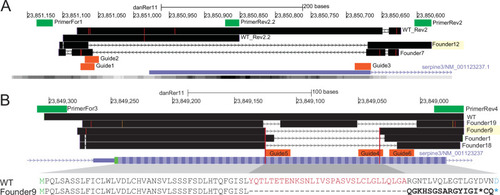
Sequenced reads are mapped against the danRer11 zebrafish genome assembly with Blat and are visualized in the UCSC genome browser (black) together with the |
( |
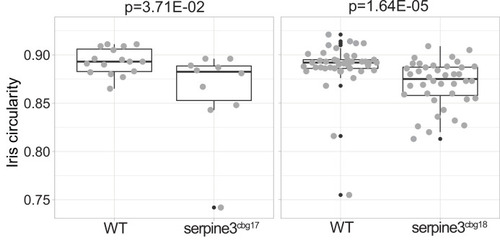
Iris circularity is another descriptor for the deviation of eye shape and is defined as 4 PHENOTYPE:
|
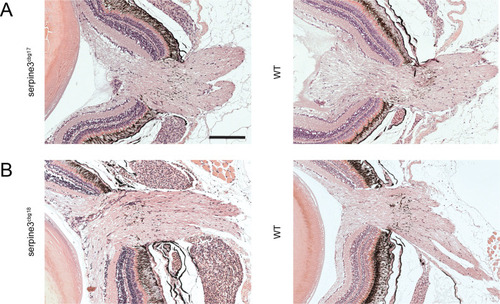
No obvious difference in optic nerve morphology is observed between PHENOTYPE:
|
We show details of representative overview images for one eye of each genotype on the right. In comparison to WT ( PHENOTYPE:
|