
- Title
-
Single-cell transcriptomic analysis of neuroepithelial cells and other cell types of the gills of zebrafish (Danio rerio) exposed to hypoxia
- Authors
- Pan, W., Godoy, R.S., Cook, D.P., Scott, A.L., Nurse, C.A., Jonz, M.G.
- Source
- Full text @ Sci. Rep.
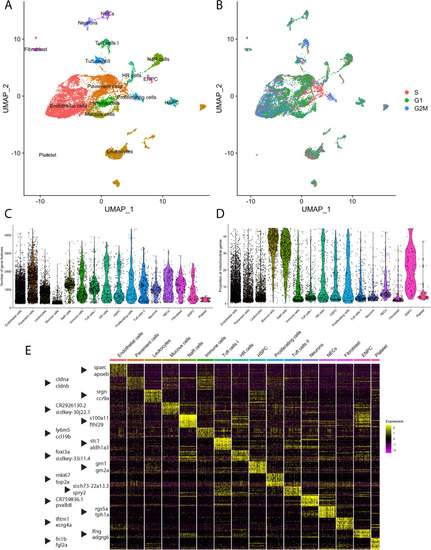
Transcriptomic atlas of gill cells dissociated from the gills of ETvmat2:EGFP zebrafish. (A) Unsupervised uniform manifold approximation projection (UMAP) plot in which gill cells were subdivided into 16 clusters. Colours correspond to separate cell clusters whose identities were defined by the major cell type present within the cluster. Identified cell clusters included (organized by decreasing abundance) endothelial cells, pavement cells, leukocytes, mucous cells, Na+/K+-ATPase-rich cells (NaR cells), immune cells, tuft cells I, H+-ATPase-rich cells (HR cells), hematopoietic stem and progenitor cells (HSPC), proliferating cells, tuft cells II, neurons, neuroepithelial cells (NECs), fibroblasts, epidermal neural progenitor cells (ENPC) and platelets. (B) UMAP visualization of cell-cycle phases of the aforementioned clusters. G1, G1 phase; G2M, G2 and metaphase; S, synthesis phase. (C) Violin plot showing the number of unique genes in each cell cluster. (D) Violin plot showing the proportion of mitochondrial genes present within each cell cluster. (E) Heatmap of the top 32 genes that were differentially enriched in each cell cluster. Two representative genes from each cluster are indicated by an arrowhead. Scaled gene expression is shown by colours, where yellow indicates relatively high expression and purple indicates relatively low expression. |
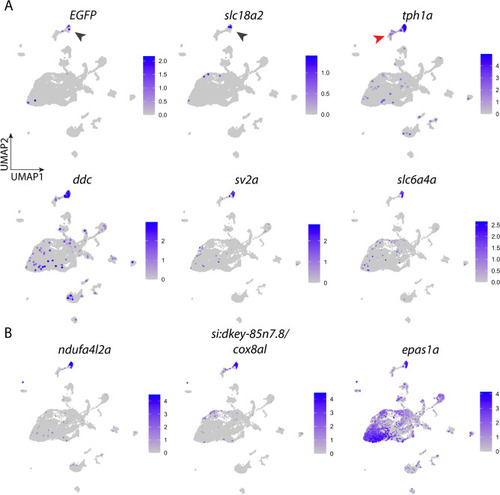
Expression of signature genes found in neuroepithelial cells (NECs). (A) UMAP plots showing the log-normalized counts of selective genes involved in identification of NECs. Colour intensity is proportional to the expression level of a given gene. Scales indicate relative gene expression. Black arrowheads indicate high expression in the NEC cluster; red arrowhead indicates expression in the neuron cluster. (B) UMAP plots showing the normalized counts of representative genes that may be involved in O2 sensing in NECs. See text and Table Table1 for gene description. |
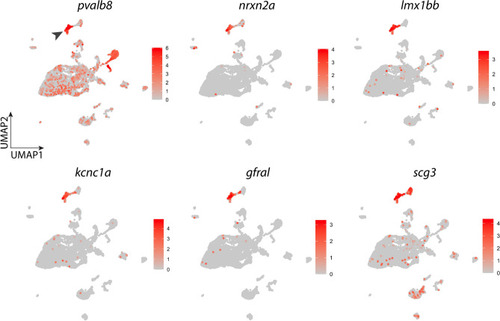
Expression of signature genes found in the neuron cluster. UMAP plots showing the log-normalized counts of selective genes that were highly differentially expressed in neurons. Colour intensity is proportional to the expression level of a given gene. Scales indicate relative gene expression. Arrowhead indicates significant expression in the neuron cluster. See text and Table Table22 for gene description. |

Comparison of gene expression between the NEC and neuron clusters. (A) UMAP plot showing the subset of the cell population containing NECs and neurons only. (B) UMAP plots showing the log-normalized expression of genes encoding membrane transporters. (C) UMAP plots showing the log-normalized expression of genes involved in Ca2+-mediated signals. (D) UMAP plots showing the log-normalized expression of genes involved in neurotransmitter release. (E) Heatmap of the top 20 highly differentially expressed genes in NECs and neurons. Scaled gene expression is shown by colours, where yellow indicates relatively high expression and purple indicates relatively low expression. See text and Tables Tables1 and 2 |
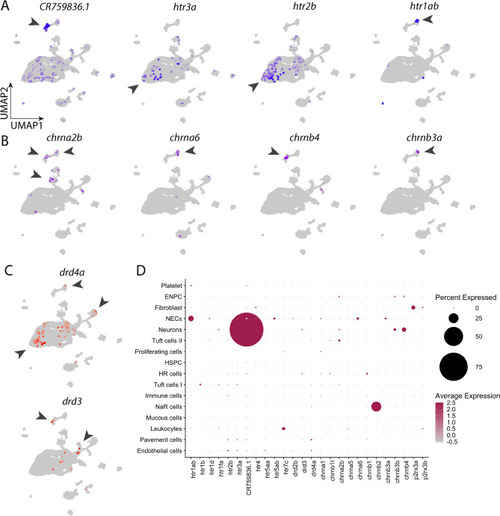
Expression of neurotransmitter receptors in the gill cell atlas. (A) UMAP plots showing the distribution of selective 5-HT receptor subunits in all cell populations. Arrowheads indicate cell clusters with significant gene expression. (B) UMAP plots showing distribution of selective cholinergic receptor subunits in all cell populations. (C) UMAP plots showing distribution of selective DA receptors in all cell populations. (D) Dotplot of 5-HT, cholinergic, dopaminergic and purinergic neurotransmitter receptor subunit expression in 16 gill cell clusters. Colour intensity is proportional to the level of expression, and the size of dot indicates the percent of cells showing gene expression in the cell cluster. All dots were manually enlarged to make receptors of lower expression more visible. Scales are provided for percent and average expression. See text and Tables Tables11 and and22 for gene description. |
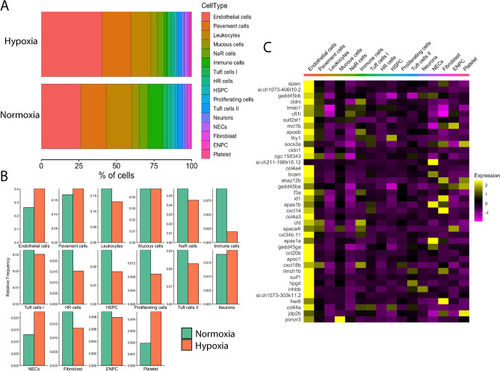
Effects of chronic hypoxia on gill cell composition and global gene expression. (A) Stacked bar graph shows the relative difference in % cell composition between normoxic and hypoxic conditions. Cell types are coded by colour and are indicated at the right. (B) Bar graphs showing changes in relative cell frequency in normoxia (green) vs. hypoxia (orange) in each cell cluster. (C) Heatmap showing the distribution of the top 40 highly differentially expressed genes in chronic hypoxia compared to normoxia. Scaled gene expression is shown by colours, where yellow indicates relatively high expression and purple indicates relatively low expression. |
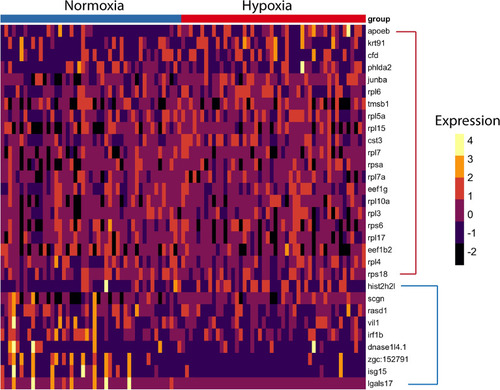
Differential gene expression analysis of NECs between normoxic and hypoxic conditions using the DEsingle method. Heatmap of highly enriched genes that were statistically significant (P < 0.05) in both normoxic and hypoxic conditions in the NEC cluster. Genes enclosed in the red bracket were significantly expressed in hypoxia. Genes enclosed in the blue bracket were significantly expressed in normoxia. |