
Image
|
Figure Caption
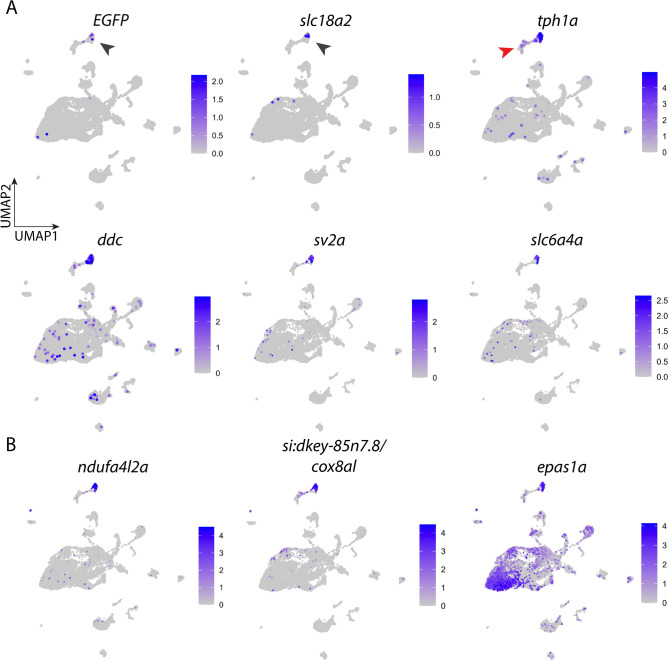
Fig. 2
Expression of signature genes found in neuroepithelial cells (NECs). (A) UMAP plots showing the log-normalized counts of selective genes involved in identification of NECs. Colour intensity is proportional to the expression level of a given gene. Scales indicate relative gene expression. Black arrowheads indicate high expression in the NEC cluster; red arrowhead indicates expression in the neuron cluster. (B) UMAP plots showing the normalized counts of representative genes that may be involved in O2 sensing in NECs. See text and Table Table1 for gene description.
Acknowledgments
This image is the copyrighted work of the attributed author or publisher, and
ZFIN has permission only to display this image to its users.
Additional permissions should be obtained from the applicable author or publisher of the image.
Full text @ Sci. Rep.