
|
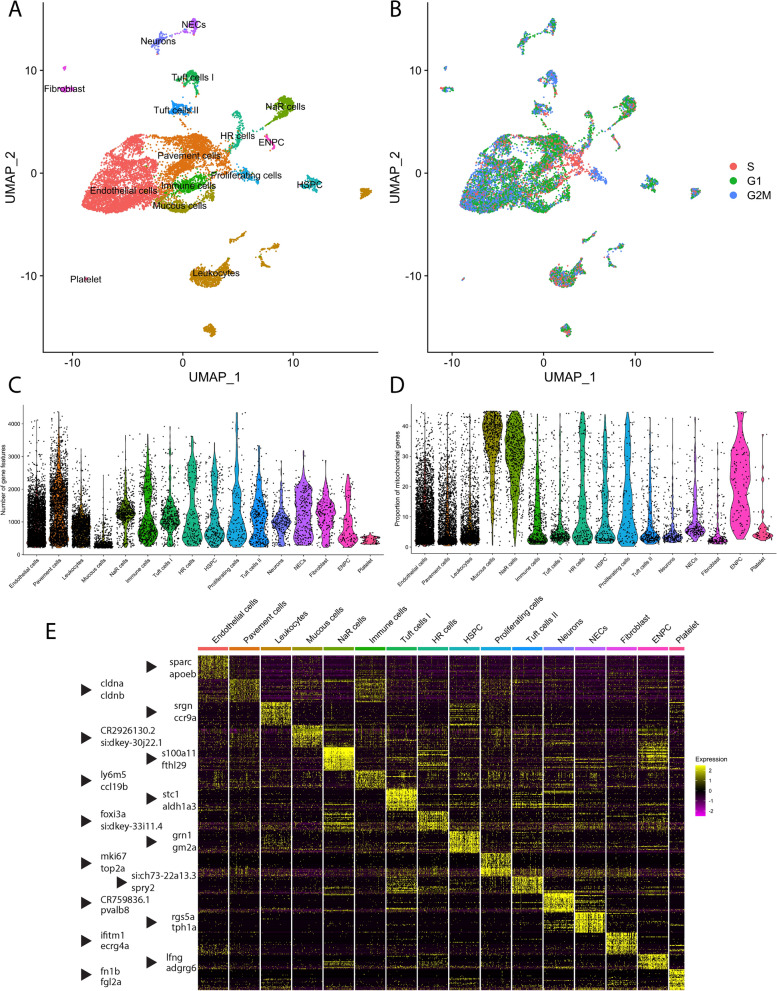
Fig. 1
Transcriptomic atlas of gill cells dissociated from the gills of ETvmat2:EGFP zebrafish. (A) Unsupervised uniform manifold approximation projection (UMAP) plot in which gill cells were subdivided into 16 clusters. Colours correspond to separate cell clusters whose identities were defined by the major cell type present within the cluster. Identified cell clusters included (organized by decreasing abundance) endothelial cells, pavement cells, leukocytes, mucous cells, Na+/K+-ATPase-rich cells (NaR cells), immune cells, tuft cells I, H+-ATPase-rich cells (HR cells), hematopoietic stem and progenitor cells (HSPC), proliferating cells, tuft cells II, neurons, neuroepithelial cells (NECs), fibroblasts, epidermal neural progenitor cells (ENPC) and platelets. (B) UMAP visualization of cell-cycle phases of the aforementioned clusters. G1, G1 phase; G2M, G2 and metaphase; S, synthesis phase. (C) Violin plot showing the number of unique genes in each cell cluster. (D) Violin plot showing the proportion of mitochondrial genes present within each cell cluster. (E) Heatmap of the top 32 genes that were differentially enriched in each cell cluster. Two representative genes from each cluster are indicated by an arrowhead. Scaled gene expression is shown by colours, where yellow indicates relatively high expression and purple indicates relatively low expression.