FIGURE SUMMARY
Title

Dopamine Level Affects Social Interaction and Color Preference Possibly Through Intestinal Microbiota in Zebrafish

Authors
Wang, J., Zheng, F., Yin, L., Shi, S., Hu, B., Qu, H., Zheng, L.
Source
Full text @ Zebrafish

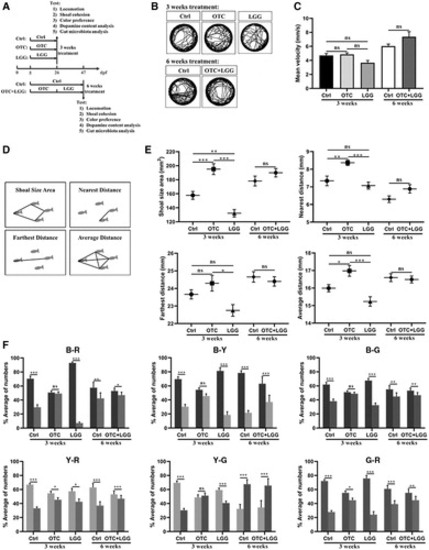
FIG. 1. Different treatments affect social interaction and color preference in zebrafish. (A) Schematic describing the experimental procedure for Ctrl, OTC, and LGG (3-week treatment), or Ctrl and OTC+LGG (6-week treatment). The behavioral trajectory (B) and the mean velocity (C) of the zebrafish from control group (Ctrl) and exposure groups (OTC, LGG, and OTC+LGG) were tested during 10-min period (n = 12/group, four groups per treatment). (D) Schematic describing the testing index of social interaction. (E) The shoaling behavior of zebrafish larvae through OTC, LGG, and OTC+LGG treatment (n = 4/group, 24 groups per treatment). (F) The shoals of zebrafish exhibit the color preference with six color combinations (B-R, B-Y, B-G, Y-R, Y-G, G-R) for OTC, LGG, and OTC+LGG treatment. The percentage of numbers of 20 larval zebrafish spent in each colored zone was counted every 20 s for a total of 10 min (n = 10 groups for Ctrl [3 weeks], n = 8 groups for OTC [3 weeks], n = 9 groups for LGG [3 weeks], n = 8 groups for Ctrl [6 weeks], n = 8 groups for OTC+LGG [6 weeks]). *p < 0.01, **p < 0.01, ***p < 0.001, ns, not significant. OTC, oxytetracycline; LGG, Lactobacillus rhamnosus GG.

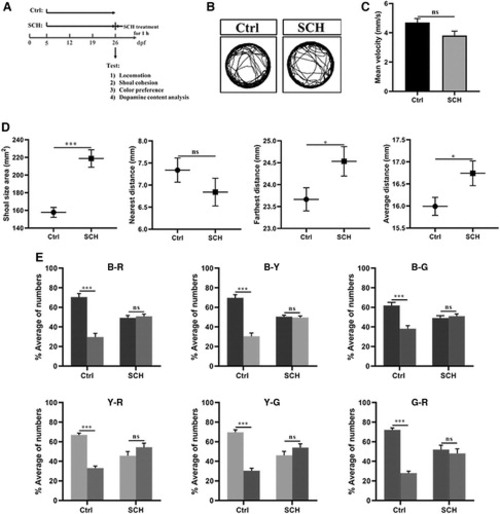
FIG. 2. SCH23390 affects shoal interaction and color preference in zebrafish. (A) Schematic describing the experimental procedure for SCH23390 treatment. The behavioral trajectory (B) and the mean velocity (C) of the zebrafish from the control group (Ctrl) and SCH23390 treatment groups (SCH) were tested during 10-min period (n = 12/group, four groups per treatment). (D) The shoaling behavior of zebrafish through SCH23390 treatment (n = 4/group, 24 groups per treatment). (E) The color preference of shoals with SCH23390 treatment in six color combinations (B-R, B-Y, B-G, Y-R, Y-G, G-R). The percentage of numbers of 20-larval zebrafish spent in each colored zone was counted every 20 s for a total of 10 min (n = 9 for Ctrl or SCH group, respectively). *p < 0.01, ***p < 0.001, ns, not significant.

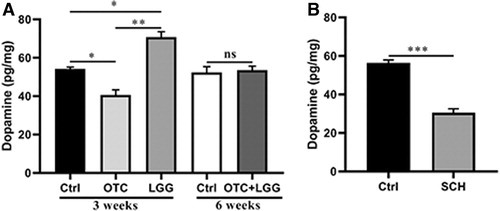
FIG. 3. Dopamine level analysis of the treatment groups. (A) The dopamine levels in the brain of fish through OTC, LGG, and OTC+LGG treatment. (B) The dopamine levels in the brain of fish through SCH23390 treatment. Data are expressed as mean ± SEM (n = 30/group, three groups). *p < 0.01, **p < 0.01, ***p < 0.001, ns, not significant.

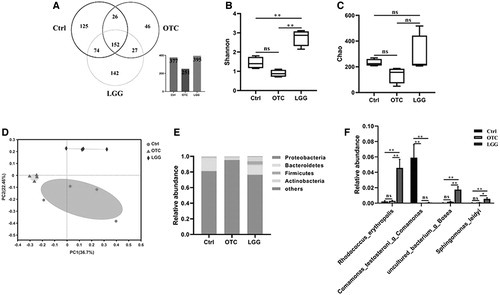
FIG. 4. Effect of OTC or LGG exposure on the intestinal microbial composition. (A) The Venn diagram of the three groups. Shannon (B) and Chao (C) index of gut microbiota in the treatment groups. (D) PCoA of intestinal bacteria in the treatment groups. Gut microbiota composition at the phylum level (E) and at the species level (F). Data are expressed as mean ± SEM (n = 30/group, four groups). *p < 0.01, **p < 0.01. ns, not significant. PCoA, principal coordinates analysis.

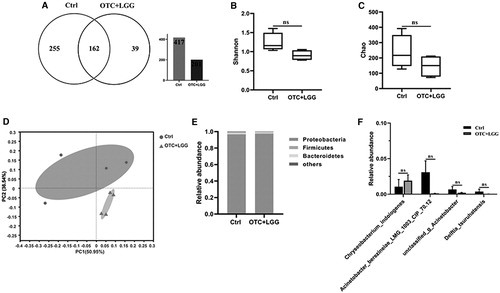
FIG. 5. Effect of OTC and LGG exposure on the intestinal microbial composition. (A) The Venn diagram of the two groups. Shannon (B) and Chao (C) index of gut microbiota in the treatment groups. (D) PCoA of intestinal bacteria in the treatment groups. Gut microbiota composition at the phylum level (E) and at the species level (F). Data are expressed as mean ± SEM (n = 30/group, four groups). ns, not significant.

Acknowledgments
This image is the copyrighted work of the attributed author or publisher, and ZFIN has permission only to display this image to its users. Additional permissions should be obtained from the applicable author or publisher of the image. Full text @ Zebrafish