
- Title
-
RNA-based therapies in animal models of Leber congenital amaurosis causing blindness
- Authors
- Wang, X., Shan, X., Gregory-Evans, K., Gregory-Evans, C.Y.
- Source
- Full text @ Precis Clin Med
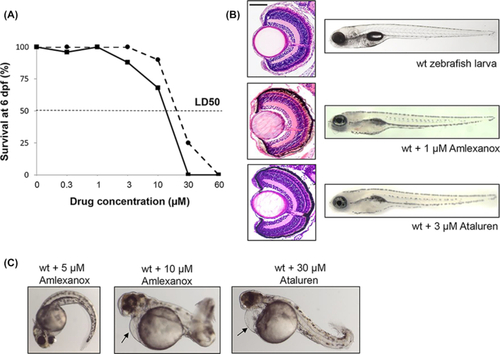
Toxicity testing for Amlexanox in wildtype (wt) zebrafish embryos. (A) Survival curves for increasing concentrations of Amlexanox (solid line) and Ataluren (dotted line) after 6 days continuous exposure. (B) At 6 dpf, Amlexanox (1 μM) and Ataluren (3 μM) had no adverse effects on ocular histology or body shape. Size bar = 50 μm. (C) At 48 hpf, 5 μM Amlexanox resulted in a curved tail, whereas at 10 μM a short, bent tail, pericardial edema (arrow) and abnormal brain and eye development was present. Exposure to 30 μM Ataluren resulted in curved tail and pericardial edema (arrow). |
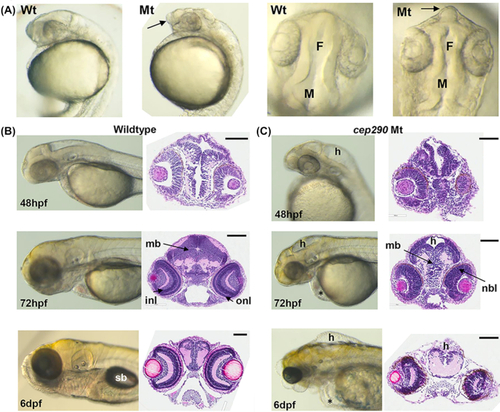
cep290 morphology (Mt) compared to wildtype (Wt) embryos. (A) Lateral and dorsal views of wholemount morphology in embryos at 24 hpf. Telencephalon (arrows) is projected forward in cep290 embryos. F, forebrain ventricle; M, midbrain ventricle. (B) Wildtype brain development at 48 hpf, 72 hpf, and 6 dpf. Left panels, wholemount morphology; right panels, transverse H and E sections through the midbrain. sb, swim bladder; mb, midbrain; onl, outer nuclear layer of the retina; inl, inner nuclear layer. Size bar = 100 μm. (C) cep290 brain development at 48 hpf, 72 hpf, and 6 dpf. Left panels, wholemount morphology; right panels, transverse H and E sections through the midbrain. h, hydrocephalus; nbl, neuroblastic layer; *periocular edema. Size bar = 100 μm. |
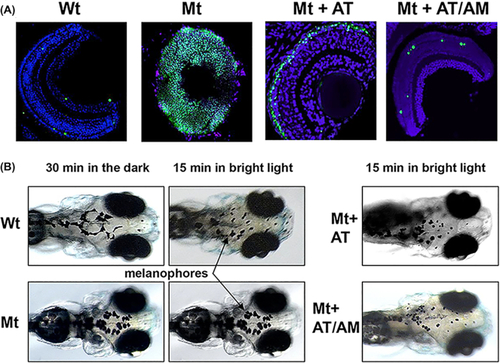
Ocular phenotype in cep290 mutants. (A) Wholemount TUNEL staining (green) comparing Wt eyes, untreated cep290 eyes (Mt), and eyes from Mt embryos treated with either 3 μM Ataluren (AT) or 3 μM AT plus 1 μM Amlexanox (AM). Sections were counterstained with DAPI. Size bar = 20 μm. (B) Visual background adaptation assay. In Wt embryos the melanophores (arrows) contract after 15 minutes of bright light, but not in cep290 embryos (Mt). Treatment with AT or AT/AM resulted in contracted melanophores in Mt embryos. PHENOTYPE:
|
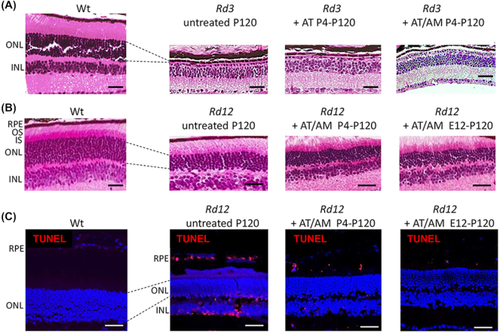
Ataluren and Amlexanox treatment in Rd3 and Rd12 mice assessed at P120. (A) H&E sections of wildtype (Wt) retina compared to Rd3 retina when treated with either Ataluren (AT) or AT plus Amlexanox (AM). ONL, outer nuclear layer; INL, inner nuclear layer. Size bar = 50 μm. (B) H&E sections of Wt retina compared to Rd12 retina when treated with combined AT plus AM postnatally (P4-P120) and prenatally and continued postnatally (E12-P120). RPE, retinal pigment epithelium; OS, outer segments; IS, inner segments. Size bar = 50 μm. (C) Cryosections with TUNEL-staining (red) in Wt and Rd12 retina treated with combined AT plus AM either postnally from P4-P120 or from E12-P120. Sections were counterstained with DAPI. Size bar in all panels = 25 μm. |
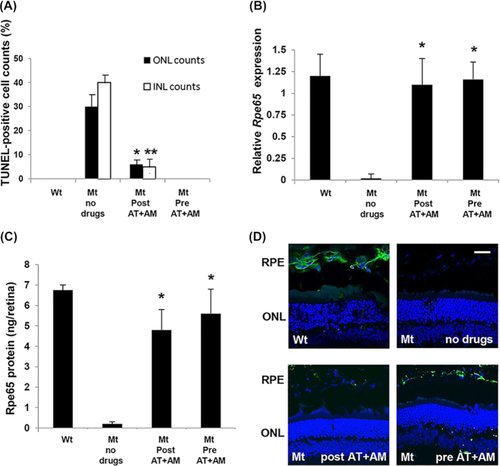
Efficacy of combined drug treatment in the Rd12 mouse eyes (Mt) compared to wildtype eyes (Wt). (A) Quantitation of the number of TUNEL-positive nuclei in the ONL or INL relative to the total number of nuclei in each layer. Drugs were given either postnatally (Post At+AM), or prenatally and then postnatally (Pre AT+AM). *P < 0.01; **P < 0.001; N = 5. (B) Relative expression of Rpe65 assessed by qRT-PCR. Data plotted as mean ± SEM. Significance comparing treatment groups with wildtype levels determined by one-way ANOVA with Tukey post hoc tests (*P = 0.94, N = 6). (C) Quantitation of Rpe65 protein in retinal/RPE extracts. Data plotted as mean ± SEM. Significance comparing treatment groups with wildtype levels determined by one-way ANOVA with Tukey post hoc tests (*P = 0.78, N = 6). (D) Immunohistochemical localization of Rpe65 protein (green) in RPE cells in different treatment groups. Sections were counterstained with DAPI. Size bar in all panels = 25 μm. |
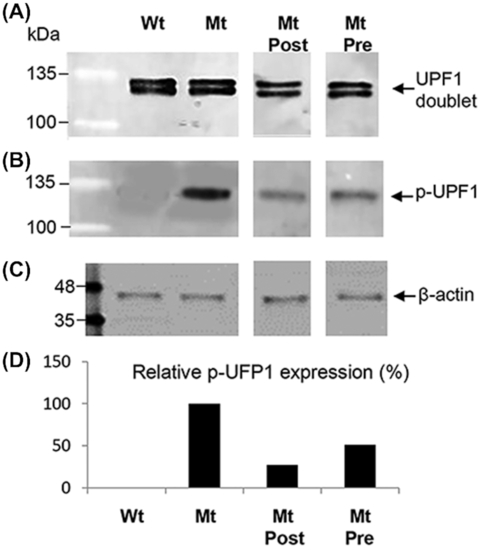
UPF1 phosphorylation in mouse Rd12 retina/RPE extracts analyzed by western blotting. (A) UPF1 protein expression in wildtype (Wt), untreated Rd12 mutants (Mt), Mt treated postnatally (Mt Post), and Mt treated prenatally plus postnatal treatment (Mt Pre). UPF1 is seen as a doublet on western blotting. (B) Phosphorylated UPF1 (p-UPF1) in Wt, Mt, Mt Post, and Mt Pre protein extracts. (C) β-actin loading control. Protein marker is BLUelf ladder. (D) Quantification of p-UPF1 expression between treatment groups relative to β-actin. Untreated Mt set as 100% p-UPF1expression level. |
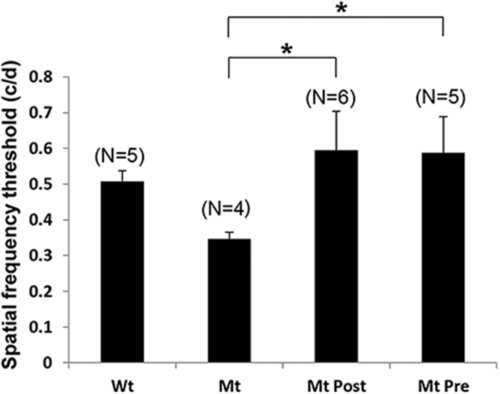
Behavioral optokinetic tracking (OKT) assessments in Rd12 mice (Mt) compared to wildtype mice (Wt). Spatial frequency threshold measured in cycles/degree (c/d) for Wt mice, untreated Mt mice, Mt treated postnatally (Mt Post), and Mt treated prenatally plus postnatal treatment (Mt Pre). Data plotted as mean ± SEM, number mice per group in parentheses. *P < 0.001. |
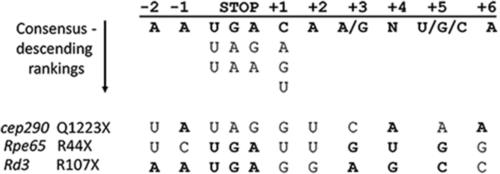
Consensus sequence for nonsense suppression. The nucleotide positions surrounding the stop codon are indicated at the top and underneath are the consensus nucleotides conferring the best read-through capability. The RNA sequences for cep290, Rpe65, and Rd3 are at the bottom. Nucleotides matching the consensus sequence are in bold. |