
- Title
-
Zebrafish Melanoma-Derived Interstitial EVs Are Carriers of ncRNAs That Induce Inflammation
- Authors
- Biagini, V., Busi, F., Anelli, V., Kerschbamer, E., Baghini, M., Gurrieri, E., Notarangelo, M., Pesce, I., van Niel, G., D'Agostino, V.G., Mione, M.
- Source
- Full text @ Int. J. Mol. Sci.
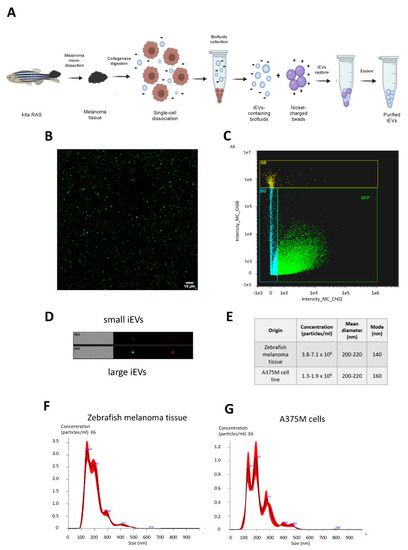
(A) Schematic representation of melanoma microdissection, single cells dissociation, and iEVs isolation following the NBI method. (B) Purified EVs from kita:RAS zebrafish melanomas (confocal microscopy, 63x magnification). (C) Representative sorting of iEVs isolated from kita:RAS zebrafish melanomas (ImageStream flow cytometer), and (D) single images of particles at the same instrument. (E) Table reporting concentration, mean, and mode diameter values retrieved from NTA performed on three independent biological samples from either kita:RAS zebrafish melanomas or the A375M human melanoma cell line. (F) Representative nanoparticle tracking analysis (NTA) profiles displaying concentration (particles/mL) vs. size distribution (nm) of iEVs isolated from kita:RAS zebrafish melanoma, and (G) EVs isolated from the cell culture supernatant of the A375M human melanoma cell line. The black curve indicates the mean of three measurements, with SD in red. |
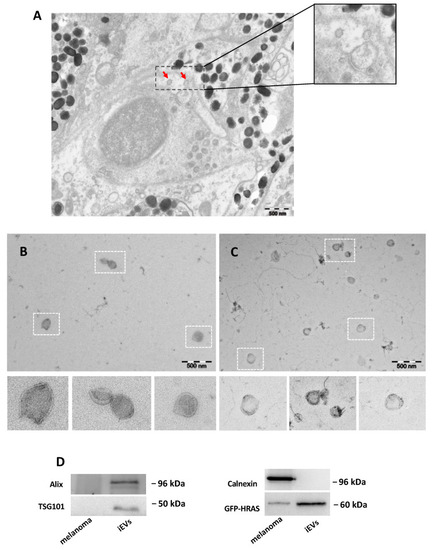
Characterization of zebrafish melanoma iEVs: (A) representative EM of zebrafish melanoma, with EVs in the tissue (red arrow); (B) representative TEM image of zebrafish melanoma iEVs purified following the NBI method. Scale bar: 500 nm. (C) Representative TEM image of zebrafish melanoma iEVs purified following the differential ultracentrifugation method. Scale bar: 500 nm. (D) Western blot analysis of whole cell lysates and lysates of isolated iEVs for exosomal-related markers or cell markers, as indicated. Loading: 1 μg total protein. EXPRESSION / LABELING:
|
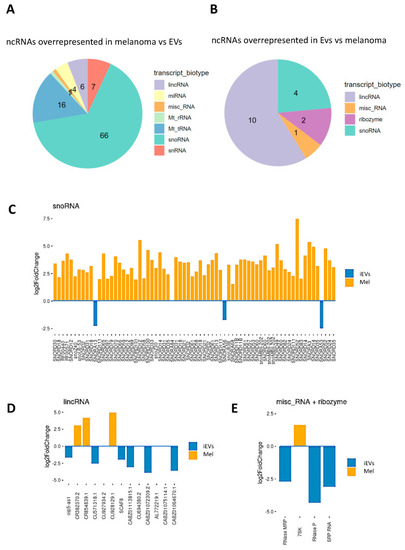
Analysis of ncRNA in iEVs and melanoma. (A,B) Pie charts representing the different ncRNA species found enriched in melanoma (A) and in their iEVs (B). ncRNAs were considered differentially expressed with adjusted p-value < 0.05 and a log2 fold change greater than 1 or smaller than −1. (C–E) Representation of the three main categories of differentially enriched species of ncRNAs (orange bars: enriched in melanoma, blue bars, enriched in iEVs) and their identity. Misc_RNA: miscellaneous RNA. |
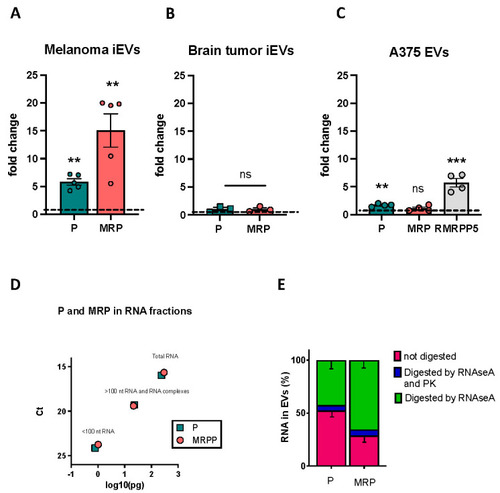
QPCR validation of P and MRP RNAs enrichment in iEVs. (A–C) Expression of P and MRP (and RMRPP5 in human cells/EVs) RNA in melanoma iEVs compared to the expression in melanoma (A), in brain tumour iEVs compared to the expression in tumour cells (B), and in A375 EVs versus A375 cells (C). In all graphs, expression in the cells of origin of the iEVs/EVs is set at 1, and data are normalized to the levels of rnu6.1/RNU6. n > 3 as represented; ** p < 0.01; *** p < 0.001. (D) Graphic representation of the amount of P and MRP found in the lower fraction (fragmented RNA), higher fraction (RNA and RNA–protein complexes), and total RNA of A375 EVs, following UV crosslinking. Values are expressed in pg and are calculated from the number of ct of a reference scale obtained with serial dilutions of P and MRP cDNA templates (see Section 4.16). (E) Percentages of P and MRP RNA lost in RNAseA digested and RNAseA + proteinase K digested in A375 EVs, as indicated. Data are from 3 biological replicates +/− SD. ns: not significant. |
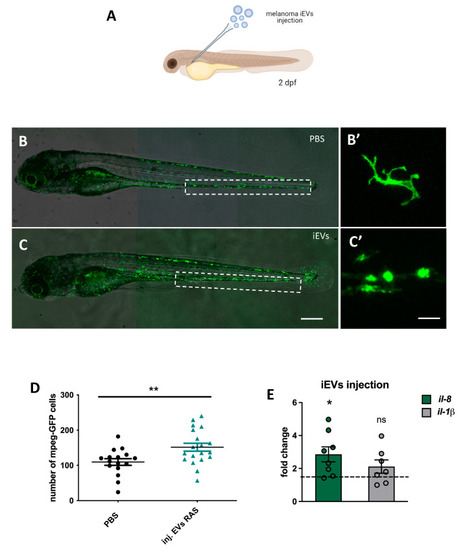
Intravascular injection of iEVs induce an inflammatory response. (A) Schematic representation of the experimental procedure for intravascular injection of melanoma iEVs (drawing realized with BioRender). (B,C) Fluorescence stereomicroscope images of 5 dpf tg(mpeg:GFP)gl222 larvae injected intravascularly with PBS or with melanoma iEVs at 2dpf, as indicated. The caudal hematopoietic tissue (CHT), where counts were performed, is boxed. (B’,C’) High magnification images of macrophages in the injected tg(mpeg:GFP)gl222 showing differences in shape in the two conditions. (D) Counts of macrophages in the CHT of injected larvae. (E) QPCR analysis of the expression of two inflammatory cytokines in iEV-injected larvae compared to PBS-injected (horizontal dashed line). * p < 0.05; ** p < 0.01. Scale bars: 100 μm. ns: not significant. |
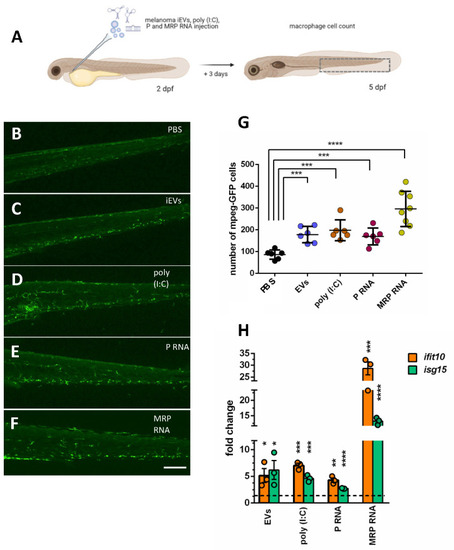
Injection of MRP or P RNA in larvae increases mpeg+ cells and IRG expression, similar to poly-I:C and iEVs. (A) Schematic representation of the experimental procedure for intravascular injection of melanoma iEVs, poly (I:C) and RNA, and inflammatory cell counts (drawing realized with BioRender). (B–F). Representative images of the CHT regions of 5 dpf tg(mpeg:GFP)gl222 larvae injected with the indicated molecules. (G)). Counts of macrophages in the CHT of injected larvae. (H) QPCR analysis of the expression of two interferon-responsive genes, ifit10 and isg15, in larvae injected with the indicated molecules, compared to PBS-injected (horizontal dashed line). * p < 0.05; ** p < 0.01; *** p < 0.005; **** p < 0.001. Scale bars: 100 μm. |