
- Title
-
Septins promote caspase activity and coordinate mitochondrial apoptosis
- Authors
- Ngo, H.V., Robertin, S., Brokatzky, D., Bielecka, M.K., Lobato-Márquez, D., Torraca, V., Mostowy, S.
- Source
- Full text @ Cytoskeleton
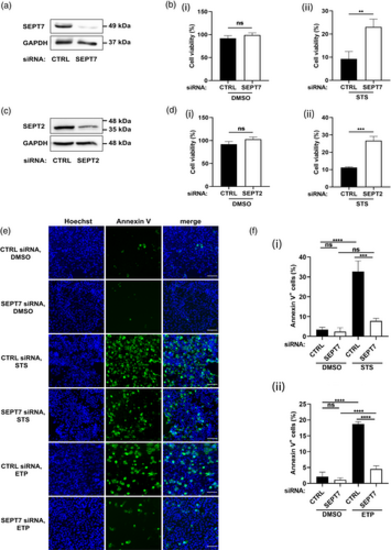
Septin-depleted cells undergo significantly less apoptosis. (a) HeLa cells were transfected for 72 hr with control (CTRL) siRNA or a siRNA targeting SEPT7. Effect of siRNA on SEPT7 expression. A representative Western blot of HeLa cell lysates is shown. GAPDH was used as a loading control. (b) Impact of siRNA targeting SEPT7 on viability of HeLa cells in (i) untreated or (ii) STS-treated conditions. Cell viability is measured using MTT assays as described in Materials and Methods. Data are mean ± SEM from three independent experiments. **p = .0069 by two-tailed Student's t test. (c) HeLa cells were transfected for 72 hr with control (CTRL) siRNA or a siRNA targeting SEPT2. Effect of siRNA on SEPT2 expression. A representative Western blot of HeLa cell lysates is shown. (d) Impact of siRNA targeting SEPT2 on viability of HeLa cells in (i) untreated or (ii) STS-treated conditions. Cell viability is measured using MTT assays as described in Materials and Methods. Data are mean ± SEM from three independent experiments. ***p = .0004 by two-tailed Student's t test. (e) Control and SEPT7-depleted cells were treated with DMSO or 1 μM STS or 500 μM ETP for 10 hr and labeled with Alexa488-Annexin V (Annexin V) and Hoechst. Representative widefield microscopy images showing Annexin V in green and Hoechst in blue. Scale bar = 100 μm. (f) The % of Annexin V positive cells is calculated in Fiji by dividing the number of cells that displayed Annexin V labeling by the total number of cells identified by nuclear Hoechst labeling, then multiplying by 100. Each bar represents the mean % ± SEM from three independent experiments (a minimum of 1,000 cells were counted per condition separated in three independent experiments). ****p < .0001by two-way ANOVA. |
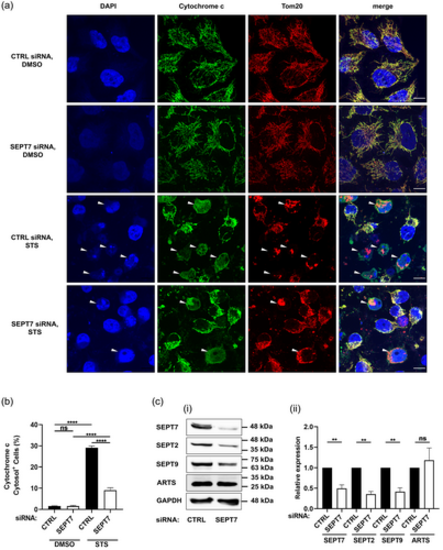
Cytochrome c release is significantly reduced in SEPT7-depleted cells. HeLa cells were transfected with control or SEPT7 siRNA, treated with DMSO or 1 μM STS for 10 hr before being fixed and labeled with an anti-cytochrome c and anti-Tom20 antibodies and DAPI. (a) Representative confocal microscopy images showing cytochrome c in green, Tom20 in red and DAPI in blue. Arrowheads indicate cells releasing cytochrome c. Scale bar = 10 μm. (b) The percentage of cells releasing cytochrome c is calculated in ImageJ by counting cells that exhibited cytosolic (rather than mitochondrial) cytochrome c labeling, and dividing by the total number of cells, then multiplying by 100. Each bar represents the mean % ± SEM from three independent experiments (a minimum of 1,000 cells were counted per condition separated in three independent experiments). ****p < .0001 by two-way ANOVA. (c) SEPT7 and ARTS act in different pathways. (i) HeLa cells were treated with control or SEPT7 siRNA for 72 hr. Whole-cell lysates were immunoblotted for SEPT7, SEPT2, SEPT9, and ARTS. GAPDH was used as a loading control. Data are representative Western blots of three independent experiments. (ii) Densitometry analysis of the bands was performed using ImageJ. Data are mean ± SEM from three independent experiments. **p < .01 by two-tailed Student's t test |

Initiator and executioner caspase cleavage is significantly reduced when septins are depleted. (a), (b) HeLa cells were transfected with control or SEPT7 siRNA for 72 hr. Cells were then treated with DMSO or (a) 1 μM STS or (b) 500 μM ETP for 10 hr. Whole-cell lysates were immunoblotted against caspase-3, cleaved caspase-3, caspase-7, caspase-9, and GAPDH (used as loading control). Data are representative of three independent experiments. (c) SEPT2 is required for caspase activation. HeLa cells were transfected with control or SEPT2 siRNA for 72 hr. Cells were then treated with DMSO or 1 μM STS for 10 hr. Whole-cell lysates were immunoblotted with antibodies to caspase-7, caspase-9, and GAPDH. Data are representative of three independent experiments. (d) HeLa cells were transfected with control or SEPT7 siRNA for 72 hr. Cells were then treated with DMSO or 1 μM STS for 10 hr. Whole-cell lysates were immunoblotted with antibodies to caspase-4, caspase-7, caspase-9, and GAPDH. Data are representative of three independent experiments |

SEPT7 is required for the activation of caspase-3. (a) Control and SEPT7-depleted cells were treated with DMSO or STS, and stained with cleaved anti-caspase-3 antibody and DAPI. Representative confocal microscopy images showing cleaved caspase-3 in red and DAPI in blue. Scale bar = 100 μm. (b) The percentage of cleaved caspase-3-stained cells was calculated in Fiji by dividing the number of cells that displayed cleaved caspase-3 staining by the total number of cells, then multiplying by 100. Each bar represents the mean % ± SEM from three independent experiments (a minimum of 1,000 cells were counted per condition separated in three independent experiments). **p < .01, ****p < .0001 by two-way ANOVA. (c) HeLa cells (CTRL or SEPT7 siRNA transfected) were treated with 1 μM staurosporine for 5 hr, followed by staining of active caspase-3 and analyzed by flow cytometry (a minimum of cells were counted per condition separated in three independent experiments). *p < 0.05, ***p < 0.001 by two-way ANOVA |

Septins are required for apoptosis induced by Shigella infection. (a) HeLa cells were transfected with control or SEPT7 siRNA for 72 hr. Cells were then infected with S. flexneri M90T or the S. flexneri ΔgalU mutant for 4 hr. Whole-cell lysates were immunoblotted against caspase-3, caspase-7, and caspase-9. GAPDH was used as a loading control. Data are representative of three independent experiments. (b) Schematic representation of CRISPR/Cas9 targeting of sept2. Three crisprRNA (crRNA, green arrows) were designed, targeting three consecutive exons (red boxes) of the zebrafish sept2 gene. (c) Representative images of control (CTRL) and sept2 crispants. Lines indicate a difference in overall body length between CTRL and sept2 crispants. Images were acquired using Leica M205 FA stereomicroscope. (d) Quantification of difference in body length between CTRL and sept2 crispants. Bars represent the mean ± SEM from three independent experiments (n = 12 larvae per bar). **p < .01 by Student's t test. (e) Survival assays of CTRL and sept2 crispants injected with approximately 9,000 CFU of either S. flexneri WT or S. flexneri ΔgalU. **p < .01, ****p < .0001 by log–rank (Mantel–Cox) test. Curves are cumulative of 3 independent experiments (n = 53–85 larvae per curve). Statistical tests for survival curves were performed using the log–rank (Mantel–Cox) test (which intrinsically take into consideration the overall trend of survival over the different times of observation), and are indicated for overall survival. (f) CFU enumeration of CTRL and sept2 crispants injected with approximately 9,000 CFU of either S. flexneri WT or S. flexneri ΔgalU. CFU were collected at 0, 6, and 24 hr post-infection, and are indicated on the X-axis. Bars represent the mean ± SEM from three independent experiments (n = 15 larvae per bar). *p < .05, ****p < .0001 by one-way ANOVA. Statistical tests for CFU counts were performed using one-way ANOVA, and are indicated for the individual timepoints |