
Fig. 2
- ID
- ZDB-FIG-231228-114
- Publication
- Ngo et al., 2022 - Septins promote caspase activity and coordinate mitochondrial apoptosis
- Other Figures
- All Figure Page
- Back to All Figure Page
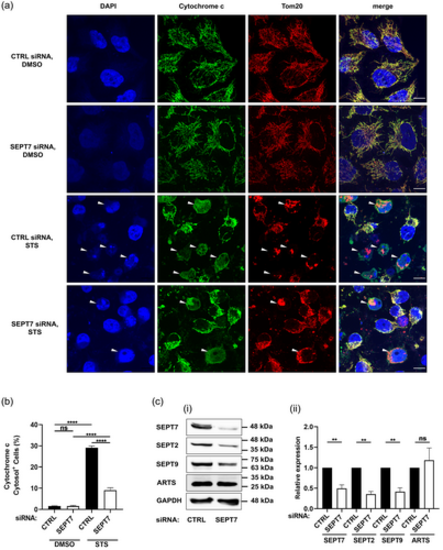
Cytochrome c release is significantly reduced in SEPT7-depleted cells. HeLa cells were transfected with control or SEPT7 siRNA, treated with DMSO or 1 μM STS for 10 hr before being fixed and labeled with an anti-cytochrome c and anti-Tom20 antibodies and DAPI. (a) Representative confocal microscopy images showing cytochrome c in green, Tom20 in red and DAPI in blue. Arrowheads indicate cells releasing cytochrome c. Scale bar = 10 μm. (b) The percentage of cells releasing cytochrome c is calculated in ImageJ by counting cells that exhibited cytosolic (rather than mitochondrial) cytochrome c labeling, and dividing by the total number of cells, then multiplying by 100. Each bar represents the mean % ± SEM from three independent experiments (a minimum of 1,000 cells were counted per condition separated in three independent experiments). ****p < .0001 by two-way ANOVA. (c) SEPT7 and ARTS act in different pathways. (i) HeLa cells were treated with control or SEPT7 siRNA for 72 hr. Whole-cell lysates were immunoblotted for SEPT7, SEPT2, SEPT9, and ARTS. GAPDH was used as a loading control. Data are representative Western blots of three independent experiments. (ii) Densitometry analysis of the bands was performed using ImageJ. Data are mean ± SEM from three independent experiments. **p < .01 by two-tailed Student's t test |