
- Title
-
Targeting chalcone binding sites in living Leishmania using a reversible fluorogenic benzochalcone probe
- Authors
- Batista, A.S., Oliveira, S.D.S., Pomel, S., Commere, P.H., Mazan, V., Lee, M., Loiseau, P.M., Rossi-Bergmann, B., Prina, E., Duval, R.
- Source
- Full text @ Biomed. Pharmacother.

Fig. 1. Examples of bioactive chalcones and their identified protein targets / mechanisms of action (left panel: natural compounds; right panel: synthetic compounds). Bcl-xL, B-cell lymphoma extra-large; DR, dopamine receptor; FR, fumarate reductase; GABA, γ-aminobutyric acid; CXCL, C-X-C lymphokine; MAO, monoamine oxidase; NF, nuclear factor; Ptp, protein tyrosine phosphatase; TXNPx, tryparedoxin peroxidase; VR, vasopressin receptor. |
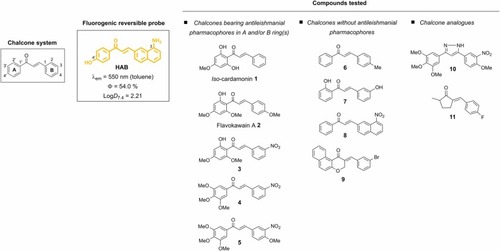
Fig. 2. Chemical structures of the reversible fluorogenic probe HAB and of selected putative competitors for cell-based studies. |
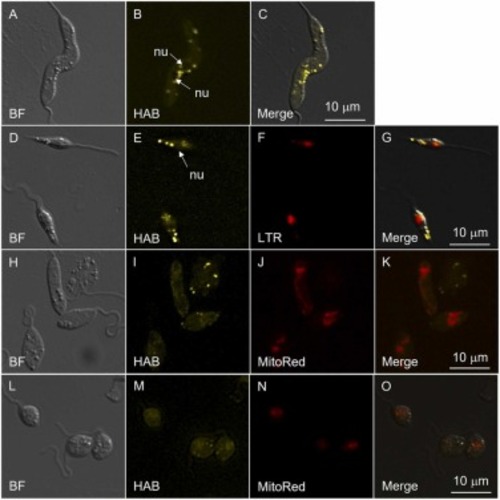
Fig. 3. Microscopic fluorescence imaging of HAB (5 µM) in L. amazonensis promastigotes in presence of LTR (100 nM) or MitoRed (50 nM). A, D, H, L: bright field imaging; B, E, I, M: HAB labelling; F: LTR labelling; J, N: MitoRed labelling; C, G, K, O: merge. Abbreviations used: nu, nucleus; BF, bright field. The images are representative of three independent experiments. |
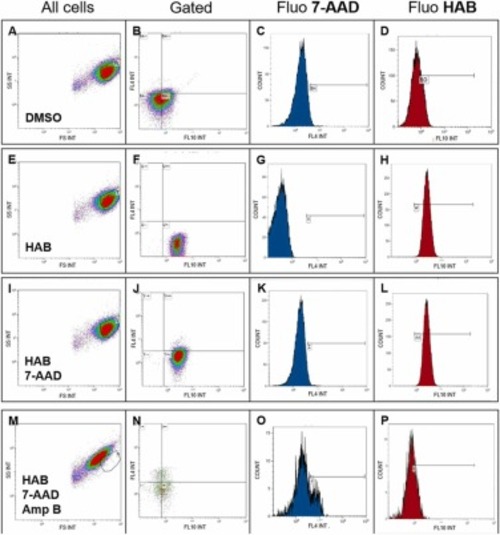
Fig. 4. Cytometric quantification of HAB (5 µM) in live L. amazonensis promastigotes (20,000 cells/µL) in presence of 7-AAD (20 µM) and presence / absence of Amp B (2 µM). A, E, I and M: morphological biparametric plots (FS, cell size; SS, cell granularity); B, F, J and N: gated plots (FL4: 7-AAD, FL10: HAB); C, G, K and O: 7-AAD cytometric histograms; D, H, L and P: HAB cytometric histograms. Plot data are representative of three independent experiments. Means and standard deviations of cell count and fluorescence intensity data (n = 3) are indicated in Table 1. |

Fig. 5. Cytometric quantification and microscopic fluorescence imaging of HAB (5 µM) in live L. amazonensis promastigotes (20,000 cells/µL) in presence of competitors 1-5 (100 µM). Co-markers were 7-AAD (40 µM), LTR (100 nM) or MitoRed (50 nM). A: morphological biparametric plot (FS, cell size; SS, cell granularity); B: gated plot (FL4: 7-AAD, FL10: HAB); C: 7-AAD cytometric histogram; D: HAB cytometric histogram; E and I: bright field (BF); F and J: HAB labelling; G: LTR labelling; K: MitoRed labelling, H and L: merge. IC50 values of competitors 1-5 are given in Table 1. Plot data are representative of three independent experiments. Means and standard deviations of cell count and fluorescence intensity data (n = 3) are indicated in Table 1. |
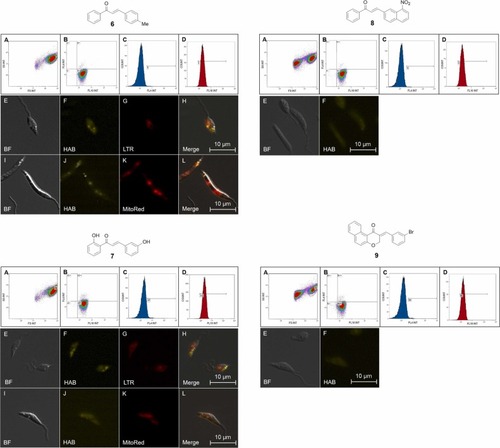
Fig. 6. Cytometric quantification and microscopic fluorescence imaging of HAB (5 µM) in live L. amazonensis promastigotes (20,000 cells/µL) in presence of competitors 6-9 (100 µM). Co-markers were 7-AAD (40 µM), LTR (100 nM) or MitoRed (50 nM). A: morphological biparametric plot (FS, cell size; SS, cell granularity); B: gated plot (FL4: 7-AAD, FL10: HAB); C: 7-AAD cytometric histogram; D: HAB cytometric histogram; E and I: bright field (BF); F and J: HAB labelling; G: LTR labelling; K: MitoRed labelling, H and L: merge. IC50 values of competitors 6-9 are given in Table 1. Plot data are representative of three independent experiments. Means and standard deviations of cell count and fluorescence intensity data (n = 3) are indicated in Table 1. |

Fig. 7. Cytometric quantification and microscopic fluorescence imaging of HAB (5 µM) in live L. amazonensis promastigotes (20,000 cells/µL) in presence of competitors 10-11 (100 µM). Co-markers were 7-AAD (40 µM), LTR (100 nM) or MitoRed (50 nM). A: morphological biparametric plot (FS, cell size; SS, cell granulosity); B: gated plot (FL4: 7-AAD, FL10: HAB); C: 7-AAD cytometric histogram; D: HAB cytometric histogram; E and I: bright field (BF); F and J: HAB labelling; G: LTR labelling; K: MitoRed labelling, H and L: merge. IC50 values of competitors 10-11 are given in Table 1. The results were done in triplicates (cytometric means and standard deviations are given in Table 1) and are representative of three independent experiments. |