
- Title
-
A zebrafish reporter line reveals immune and neuronal expression of endogenous retrovirus
- Authors
- Rutherford, H.A., Clarke, A., Chambers, E.V., Petts, J.J., Carson, E.G., Isles, H.M., Duque-Jaramillo, A., Renshaw, S.A., Levraud, J.P., Hamilton, N.
- Source
- Full text @ Dis. Model. Mech.
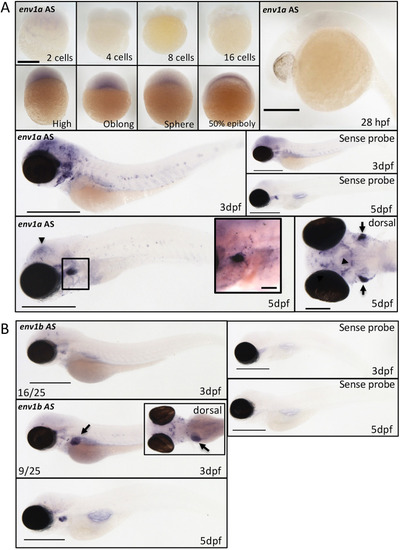
Reporter line for zferv1a recapitulates endogenous expression. (A) Expression of the envelope gene (env) of zferv1a (called env1a here) using antisense (AS) and sense in situ hybridisation RNA probes from the two-cell stage until 5 dpf (black arrowheads point to brain expression). Scale bars: 500 µm unless specified otherwise. Bottom left panel shows dorsal view of env1aAS expression in the brain (black arrowheads) and thymus (black arrows). Scale bar: 200 µm. Inset shows a magnified image of the thymus area (boxed), highlighting strong expression around the thymus with single positive cells visible in the vicinity of the thymus around the ear and alongside the branchial arches. Scale bar: 70 µm. (B) Expression of the envelope gene (env) of zferv1b (called env1b AS here) by in situ hybridisation at 3 dpf and 5 dpf. Liver expression is highlighted by black arrows. Inset shows dorsal view of the asymmetric liver expression. Scale bars: 500 µm. |
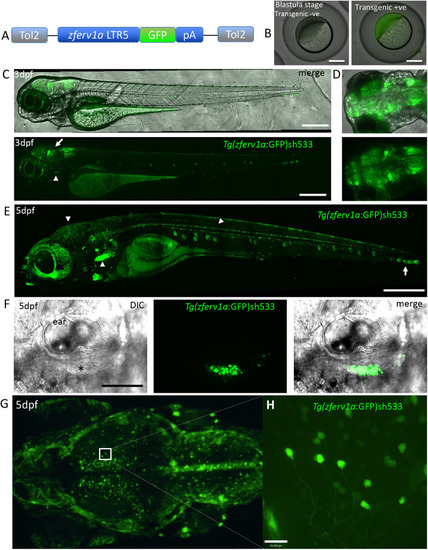
Reporter line for zferv1a recapitulates endogenous expression. (A) Diagram of the Gateway construct used to create the Tg(zferv1a:GFP) reporter line using the pDestCryCFP Tol2 backbone. (B) Representative images of non-transgenic and Tg(zferv1a:GFP:pA)sh533 transgenic embryos at the blastula stage. (C) Lateral view of DIC and GFP high-resolution images of a 3 dpf Tg(zferv1a:GFP:pA)sh533 embryo, displaying high expression of the transgene in the brain (white arrow) and the start of a signal in the thymus (white arrowheads). Scale bars: 400 µm. (D) Dorsal view of the brain at 3 dpf, showing GFP expression alone or merged with brightfield image. (E) High-resolution image of a 5 dpf Tg(zferv1a:GFP:pA)sh533 embryo, displaying high expression of the transgene in the thymus, brain and spinal cord (white arrowheads). Note the signal in neuromasts alongside the trunk (white arrow). Scale bar: 500 µm. (F) Single-slice DIC and confocal GFP fluorescence merged image of the thymus (black asterisk) situated underneath the ear in 5 dpf embryos and the signal from the Tg(zferv1a:GFP)sh533 reporter. Scale bar: 100 µm. (G) Dorsal view of a maximum projection of the brain from a 5 dpf Tg(zferv1a:GFP) embryo acquired with a lightsheet microscope. (H) High-resolution single-slice image from the optic tectum of the same Tg(zferv1a:GFP) embryo. Scale bar: 15 µm. |
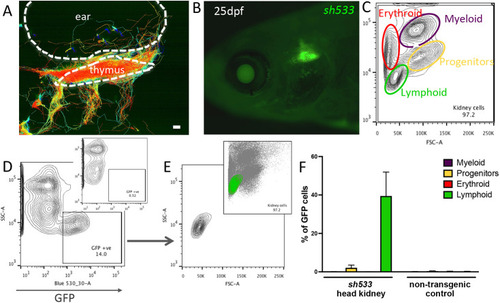
zferv1a is expressed in cells from the lymphoid lineage in adult haematopoietic tissues. (A) Cell tracking reveals dynamic behaviour of entry and exit of the thymus by GFP-positive cells in Tg(zferv1a:GFP)sh533. Whole-stack analysis of cell movement using TrackMate in Fiji. Scale bar: 10 µm. (B) Expression of Tg(zferv1a:GFP)sh533 in a 25 dpf zebrafish highlighting the triangular shaped thymus. (C) Forward scatter (FSC)/side scatter (SSC) plot of a whole kidney marrow separating different haematopoietic lineages by size and granularity. (D) SSC and GFP plot from a single-cell suspension of a whole kidney marrow from an adult Tg(zferv1a:GFP) with gate selecting GFP-positive cells. Inset shows the distribution of cells from a non-transgenic adult whole kidney marrow. (E) FSC/SSC plot of selected GFP-positive cells from D. Inset shows the location of the GFP-positive cells in the haematopoietic lineage FSC/SSC plot. (F) Quantification of GFP-positive cells in myeloid, erythroid, lymphoid lineages and progenitors from dissected sh533 and non-transgenic control adult head kidneys (n=3). |

Immune expression of zferv1a is restricted to CD4+ cells and T cells. (A-D″) Single-slice confocal image of the thymus from double-transgenic Tg(zferv1a:GFP)sh533 and Tg(mpeg1:mCherryCAAX)sh378, which labels macrophage membranes (A-A″, white arrows point to a single macrophage), Tg(lck:mCherry), which labels T cells (B-B″), Tg(lyz:nfsb-mCherry)sh260, which labels neutrophils (C-C″, white arrows point to a single neutrophil), and Tg(CD4:mCherryCAAX), which labels CD4+ cells (D-D″) with merge image used for colocalisation analysis. (E) Histogram of ImageJ-generated colocalisation coefficients of Tg(zferv1a:GFP)sh533 crossed to Tg(mpeg1:mCherryCAAX)sh378 for macrophages, Tg(lyz:nfsb-mCherry)sh260 for neutrophils, Tg(CD4:mCherry) for CD4+ cells and Tg(lck:mCherry) for T cells (one-way ANOVA, n=4). (F) Violin plot of single-cell RNA-sequencing datasets MTAB-5530 and E-MTAB-4617 from zebrafish adult whole kidney marrow and spleen showing expression of zferv1a (ENSDARG00000110878) in multiple haematopoietic lineages. P=1.95×10⁻¹¹ for CD4+ versus the other clusters and P=1.97×10−45 for T cells versus the other clusters (Mann–Whitney with paired Wilcoxon test). HSPCs, haematopoietic stem and progenitor cells. |