
|
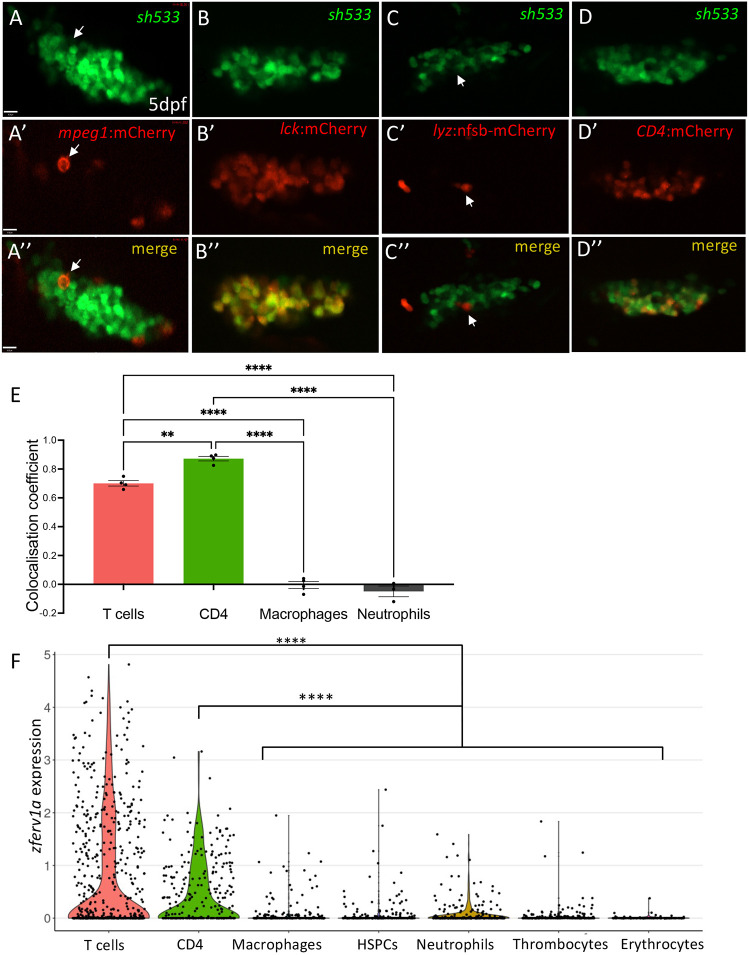
Fig. 5.
Immune expression of zferv1a is restricted to CD4+ cells and T cells. (A-D″) Single-slice confocal image of the thymus from double-transgenic Tg(zferv1a:GFP)sh533 and Tg(mpeg1:mCherryCAAX)sh378, which labels macrophage membranes (A-A″, white arrows point to a single macrophage), Tg(lck:mCherry), which labels T cells (B-B″), Tg(lyz:nfsb-mCherry)sh260, which labels neutrophils (C-C″, white arrows point to a single neutrophil), and Tg(CD4:mCherryCAAX), which labels CD4+ cells (D-D″) with merge image used for colocalisation analysis. (E) Histogram of ImageJ-generated colocalisation coefficients of Tg(zferv1a:GFP)sh533 crossed to Tg(mpeg1:mCherryCAAX)sh378 for macrophages, Tg(lyz:nfsb-mCherry)sh260 for neutrophils, Tg(CD4:mCherry) for CD4+ cells and Tg(lck:mCherry) for T cells (one-way ANOVA, n=4). (F) Violin plot of single-cell RNA-sequencing datasets MTAB-5530 and E-MTAB-4617 from zebrafish adult whole kidney marrow and spleen showing expression of zferv1a (ENSDARG00000110878) in multiple haematopoietic lineages. P=1.95×10⁻¹¹ for CD4+ versus the other clusters and P=1.97×10−45 for T cells versus the other clusters (Mann–Whitney with paired Wilcoxon test). HSPCs, haematopoietic stem and progenitor cells.