
FIGURE SUMMARY
- Title
-
Power-effective scanning with AODs for 3D optogenic applications
- Authors
- Ricci, P., Marchetti, M., Sorelli, M., Turrini, L., Resta, F., Gavryusev, V., de Vito, G., Sancataldo, G., Vanzi, F., Silvestri, L., Pavone, F.S.
- Source
- Full text @ J. Biophotonics
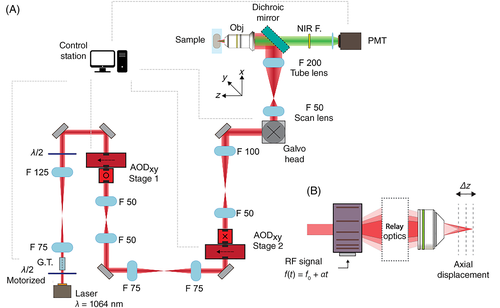
Schematic of the AOD-based scanning head. A, Optical setup with hybrid galvo-AOD scanning head implemented for 2P excitation. B, Optical diagram of the AOL focusing performance and the induced axial displacement with respect to the inherent objective focal plane. 2P, Two-photon; AOD, acousto-optic deflector; AOL, acousto-optic lens; F, focal length; G.T., Glan-Taylor polarizer; NIR F, near-infrared filter; RF, radio frequency
|

A,B. Transmission efficiency of the second stage as a function of the acoustic frequency driving the AOD. The bandwidths addressed in the ST and MT modes are colored in blue and orange, respectively. A, Low chirp case: α = 0.2 MHz/μs. B, High chirp case: α = 0.5 MHz/μs. The number of triggers is indicated for the MT modality. C, Top: Schematic of the RF signals used to drive each AOD in the ST (blue) and MT (orange) modes. After the chirp α is defined, a frequency ramp is generated once (single trigger) or repeated multiple times (multitrigger) within the dwell time window. Bottom: The simulated integrated signal collected by the PMT. D, Normalized fluorescence signal collected by the PMT as a function of the applied chirp, addressing light in separate planes with ST (blue) and MT (orange) configurations; 2D raster scans are obtained by illuminating 10 × 10 points with a dwell time of 20 μs. The integration time of the PMT was set consistently to 20 μs. AOD, Acousto-optic deflector; MT, multitrigger; ST, single trigger
|

A, Schematic of the electrophysiological recording setup. The pipette tip was positioned in the center of the ROI (orange square) addressed by light stimulation. The dashed gray square indicates the plane selected by the AOD scanning stage. 2D raster scans of 20 × 20 pts were repeated to reach the maximum evocable peak amplitudes, obtained after n = 5 stimulation cycles with a dwell time ΔT = 20 μs. B, Schematic of AOD axial scanning where the chirp parameter is modulated from −2 MHz/μs to +2 MHz/μs, addressing different planes. Each chirp unitary step corresponds to an axial shift of 7.70 μm with respect to the inherent objective focal position. C, Representative average LFP traces were recorded in zebrafish larvae expressing GCaMP (green) and with ReaChR (red) in neurons, relatively time-shifted to match the stimulation trigger (brown). The test was repeated for N = 3 larvae. The full stimulation time for both the cases was ΔTtot = 12.5 ms. D, Fluorescence image of larval zebrafish hindbrain acquired using galvo scanning mode. The orange square highlights the ROI selected for AOD light targeting. The fluorescent recording electrode tip is visible inside the ROI. E, Normalized amplitudes of the electrophysiological responses induced in single trigger (ST, blue) or multitrigger (MT, orange) conditions (n = 1 scanning cycle for each plane). Data from N = 4 zebrafish larvae are indicated by different symbols. Black lines join the average values for each animal. Thick horizontal black lines indicate the global average values in the two conditions. F, Normalized LFP amplitudes evoked in the two trigger conditions as a function of the chirp value. Different symbols indicate data from N = 7 zebrafish larvae. Line segments join mean values for each trigger condition and chirp value (n = 5 scanning cycles each plane). G, The colored curves indicate the estimated probability to observe an electrophysiological response evoked by light stimulation for the two trigger modalities as a function of the chirp values (n = 5 scanning cycles for each plane). Positive and negative events recorded from all the N = 7 zebrafish larvae with the two trigger modalities are reported by colored spots, respectively, in the top and bottom areas of the plot, for the corresponding chirp values. E,F, Statistically significant differences between all the comparisons between ST and MT acquisition are indicated by three asterisks (P value < .0001). The number of positive and missed events is reported in Supplementary Material in Table S2. AOD, Acousto-optic deflector; LFP, local field potential; Optostim., optostimulation; ROI, region of interest
|
Acknowledgments
This image is the copyrighted work of the attributed author or publisher, and
ZFIN has permission only to display this image to its users.
Additional permissions should be obtained from the applicable author or publisher of the image.
Full text @ J. Biophotonics