
- Title
-
Host tp53 mutation induces gut dysbiosis eliciting inflammation through disturbed sialic acid metabolism
- Authors
- Lee, J.G., Lee, S., Jeon, J., Kong, H.G., Cho, H.J., Kim, J.H., Kim, S.Y., Oh, M.J., Lee, D., Seo, N., Park, K.H., Yu, K., An, H.J., Ryu, C.M., Lee, J.S.
- Source
- Full text @ Microbiome
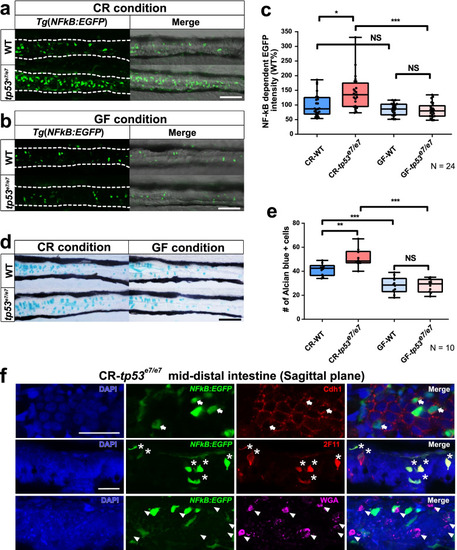
tp53 mutants exhibit elevated NF-κB signaling in the mid-distal intestines due to intestinal bacteria. a, b NF-κB signaling in the mid-distal intestines of WT or tp53 mutants was monitored using Tg(NFκB:EGFP) transgenic zebrafish larvae at 7 dpf. CR (a), conventionally raised. GF (b), germfree. Scale bar = 50 μm. White dashed lines denote boundaries of GITs based on DIC bright field images. c A boxed plot showing comparison of fluorescence intensity of the mid-distal intestines of WT and tp53 mutants under CR- or GF-condition. N = 24 each. d Alcian blue staining visualizing goblet cells in the mid-distal intestines of WT or tp53 mutants under CR- or GF- conditions. N = 10 each. Scale bar = 50 μm. e A boxed plot showing comparison of the number of Alcian blue-positive goblet cells in the mid-distal intestines of WT and tp53 mutants under CR- or GF- conditions. f To reveal cell types of NF-κB positive cells, EGFP-positive cells in the sagittal sections through the mid-distal intestine of tp53 mutant Tg(NFκB:EGFP) at 7dpf under CR condition stained for markers of pan-secretory cells (2F11), enterocytes (Cdh1), goblet cells (WGA) using immunohistochemistry. The NF-κB dependent EGFP-positive intestinal cells were clearly positive with Cdh1 (white arrows) and 2F11 (white asterisks), but negative with WGA (white arrowheads)-positive cells. Scale bar = 20 μm. The boxed plots in (c) and (e) were statistically estimated by non-parametric Friedman test followed by Dunn’s multiple comparisons test. Data are represented as mean ± SEM. *< p = 0.05; **< p = 0.01; ***< p = 0.005 |
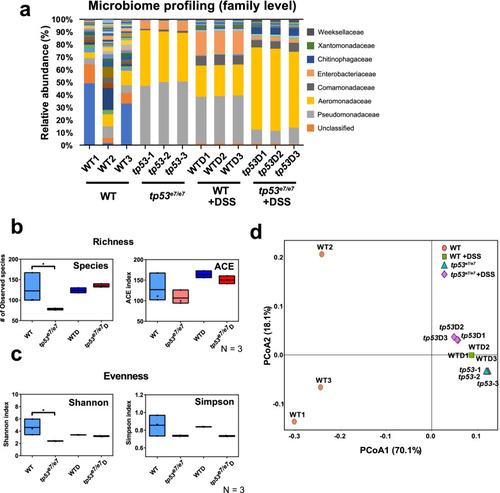
tp53 mutants harbor intestinal dysbiosis revealed by metagenome analysis. a Metagenome analysis of the intestinal microbiota of WT and tp53 mutants with or without DSS treatment at a family level. Each family is color-coded according to the key panel on the right. Each sample was repeated three times. b, c Alpha diversity (richness and evenness) comparison of the microbiota of WT, tp53 mutants, WT+DSS (WTD), and tp53 mutants + DSS (tp53D). d Principle coordinate analyses (PCoA, unweighted) visualizing the microbiotal relationship of samples from different conditions. PCoA scores were plotted based on the relative abundance of OTUs of taxonomic families of gut microbiota from WT and tp53 mutants. Samples from the same conditions were grouped together except WT samples. The boxed plots in (b) and (c) were statistically estimated by one-way ANOVA followed by Newman-Keuls multiple comparisons test. Data are represented as mean ± SEM. *< p = 0.05 |
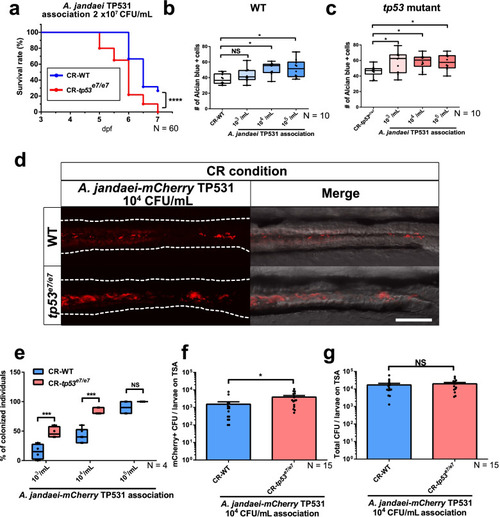
Aeromonas jandaei TP531 preferentially elicits increased goblet cell numbers and colonizes GITs of tp53 mutants. a A lethality curve of Aeromonas jandaei TP531 association (2 × 10⁷ CFU/mL) with WT or tp53 mutant larvae starting at 3 dpf. N = 60 each. The lethality curve was statistically estimated by Gehan-Breslow-Wilcoxon test. b, c Association of increasing titers of A. jandaei TP531 (103~105 CFU/mL) increased the number of Alcian blue-positive goblet cells in the mid-distal intestines of tp53 mutants (c) more than of WT (b) at 7 dpf. N = 10 each. d Association of mCherry-tagged A. jandaei TP531 (104 CFU/mL) preferred to colonize the GITs of tp53 mutants under CR (conventionally raised) condition. White dashed lines denote boundaries of GITs based on DIC bright field images. Scale bar = 50 μm. e A boxed plot of percentages of WT or tp53 mutants larvae colonized by mCherry-tagged A. jandaei TP531 at 7 dpf. N = 4 each. The boxed plots were statistically estimated by non-parametric Friedman test followed by Dunn’s multiple comparisons test. f, g Bar graph of the numbers of mCherry-tagged A. jandaei TP531 colonies (f) or total colonies (g) in TSA plates. N = 15 each. The bar graph was statistically estimated by Mann-Whitney U test. Data are represented as mean ± SEM. *< p = 0.05; ***< p = 0.005; ****< p = 0.0001. NS not significant |
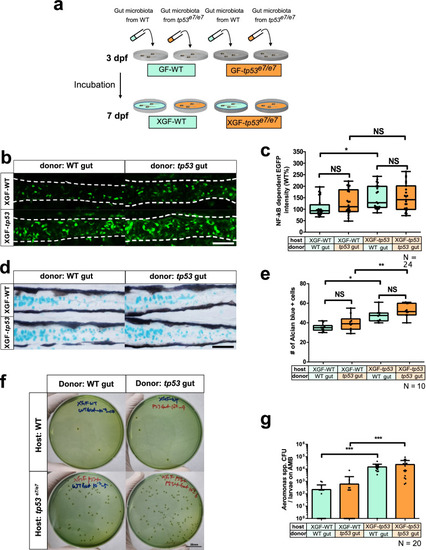
tp53 mutation of the host, not the intestinal bacteria, plays a deterministic role in elevated NF-κB signaling and increased goblet cell numbers. a A schematic for ex-GF experiments where GF-grown WT or tp53 mutant embryos were associated with 7 dpf microbiota of CR WT or tp53 mutants at 3 dpf and examined for their responses at 7 dpf. Final density of microbiota was approximately 104 CFU/mL, as assayed by aerobic growth on TSA plates at 37 °C. b Representative confocal images of the Tg(NFκB:EGFP)-based NF-κB signaling of ex-GF experiments. White dashed lines denote boundaries of GITs based on DIC bright field images. c A boxed plot of NFκB-dependent EGFP fluorescence intensity in ex-GF experiments. Significant differences were identified only in ex-GF tp53 mutant host associated with WT microbiota. N = 24 each. d Representative images of Alcian blue-positive goblet cells of ex-GF experiments. e A boxed plot of the Alcian blue-positive goblet cell number in ex-GF experiments. N = 10 each. f Representative pictures of bacterial cultures from ex-GF experiments using Aeromonas medium base (AMB) plates. Aeromonas spp. was identified based on manufactural criteria (refer to Methods for details). Scale bar = 20 mm. g A bar graph showing a comparison of the Aeromonas spp. CFUs of the ex-GF experiment in AMB plates. The number of Aeromonas spp. colonies in tp53 mutants host associated with WT or tp53 mutant microbiota dramatically increased, whereas those of WT host did not. N = 20 each. The boxed plots and the bar graph were statistically estimated by non-parametric Friedman test followed by Dunn’s multiple comparisons test. Data are represented as mean ± SEM. *< p = .05; **< p = 0.01; ***< p = 0.005. NS not significant |
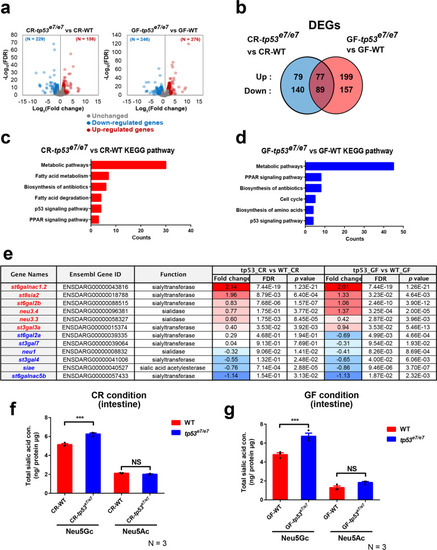
Sialic acid metabolism pathway is compromised in tp53 mutants. a The volcano plots illustrating the comparison of the expression signature of the GITs of WT and tp53 mutants under CR- or GF- conditions at 7 dpf. Each sample was repeated two times. The colored dots show the differentially up- (red) or down- (blue) regulated or unchanged (gray) genes in the GITs of tp53 mutant compared with WT under CR- or GF- conditions at 7 dpf (|log2FC| > 1, FDR < 0.05). b Ben diagram illustrating that 385 (156 upregulated and 229 downregulated) or 522 (276 upregulated and 246 downregulated) differentially expressed genes (DEGs) were identified when CR-WT vs. CR-tp53 mutants or GF-WT vs. GF-tp53 mutants was compared, respectively (|log2FC| > 1, FDR < 0.05). 166 DEGs were common between those two conditions. c, d KEGG pathway analyses of CR-WT vs. CR-tp53 mutants (c) or GF-WT vs. GF-tp53 mutants (d) revealed major altered pathways under each comparison, with a change in metabolic pathways most affected. e A list of DEGs implicated in sialic acid metabolism. Fold changes (log2 scale) in red or blue denote up-regulated or down-regulated expression, respectively, with the color intensity correlated with the magnitude of fold changes. f, g HPLC-FLD analyses of total Neu5Gc and Neu5Ac amounts of WT or tp53 mutant GITs under CR (f)- or GF (g)- condition. Bar graphs were statistically estimated by one-way ANOVA followed by Newman-Keuls multiple comparisons test. Data are represented as mean ± SEM. N = 3 each. ***< p = 0.005. NS not significant |
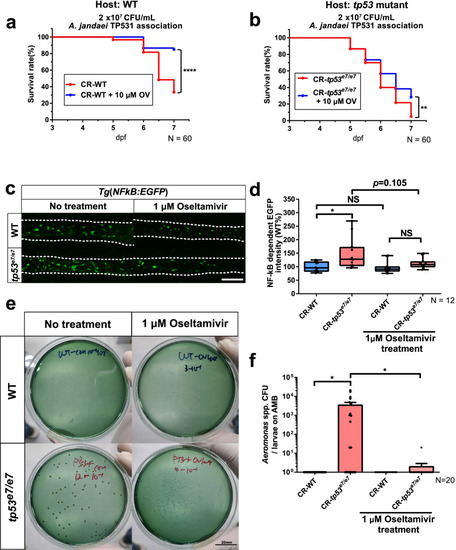
Overgrowth of endogenous Aeromonas spp. in tp53 mutants requires a sialidase activity. a, b A lethality curve of Aeromonas jandaei TP531 association (2 × 10⁷ CFU/mL) with WT (a) or tp53 mutant (b) larvae upon the treatment of oseltamivir (10 μM) starting at 3 dpf. N = 60 each. The lethality curve was statistically estimated by Gehan-Breslow-Wilcoxon test. c Representative images showing that oseltamivir (1 μM) treatment dampened an elevated inflammatory response in tp53 mutants monitored by Tg(NFκB:EGFP). White dashed lines denote boundaries of GITs based on DIC bright field images. Scale bar = 50 μm. d A boxed plot of changes of NFκB dependent EGFP intensities in the mid-distal intestines of WT and tp53 mutants upon oseltamivir treatment. N = 12 each. e Representative pictures of bacterial cultures from WT or tp53 mutants using Aeromonas medium base with or without oseltamivir treatment. Aeromonas spp. was identified based on manufactural criteria (refer to Methods for details). Scale bar = 20 mm. f A bar graph showing that the dramatically increased CFU numbers of Aeromonas spp. in tp53 mutants were abrogated upon treatment of oseltamivir (1 μM). The boxed plot and the bar graph were statistically estimated by non-parametric Friedman test followed by Dunn’s multiple comparisons test. Data are represented as mean ± SEM. N = 20 each. *< p = 0.05; **< p = 0.01; ****< p = 0.001. NS not significant |
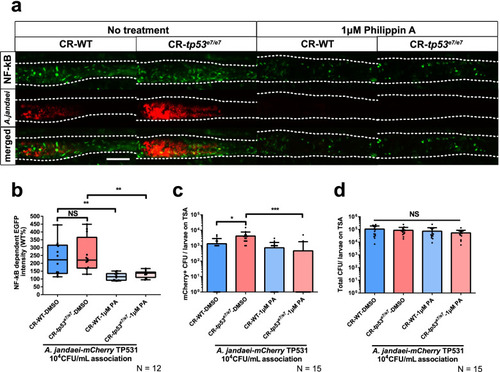
Elevated NF-κB signaling by exogenous Aeromonas in tp53 mutants was abolished by Philippin A derived from nature product. a Representative images of elevated NF-κB signaling and colonization by exogenously added mCherry-tagged A. jandaei TP531 in WT and tp53 mutants with or without Philippin A (1 μM) treatment. White dashed lines denote boundaries of GITs based on DIC bright field images. Scale bar = 50 μm. b A boxed plot showing that elevated NF-κB signaling monitored by Tg(NFκB:EGFP) in the mid-distal intestines with mCherry-tagged A. jandaei TP531 was abolished upon Philippin A treatment. c A bar graph showing that the enhanced survivability of mCherry-tagged A. jandaei TP531 in tp53 mutants was abolished upon Philippin A treatment. d A bar graph showing that Philippin A treatment did not significantly affect total bacterial populations on TSA plates. The boxed plot and bar graph were statistically estimated by non-parametric Friedman test followed by Dunn’s multiple comparisons test. Data are represented as mean ± SEM. *< p = 0.05; **< p = 0.01; NS not significant |