
- Title
-
Formimidoyltransferase cyclodeaminase prevents the starvation-induced liver hepatomegaly and dysfunction through downregulating mTORC1
- Authors
- Zhang, W., Wu, C., Ni, R., Yang, Q., Luo, L., He, J.
- Source
- Full text @ PLoS Genet.
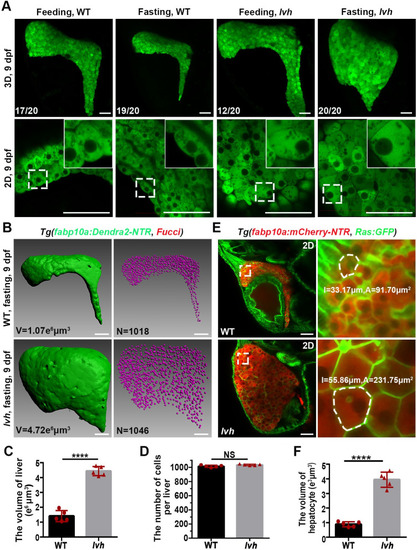
The lvh mutant exhibits hepatomegaly and enlarged hepatocyte size under fasting. (A) Confocal 3D projection and 2D single-optical section images of the liver under feeding and fasting in the wild-type or lvh mutant at 9 dpf. Higher magnification images showing single hepatocytes are displayed upright. (B) 3D reconstruction images showing the liver volumes and hepatocyte nuclei of the wild-type and lvh mutant at 9 dpf. (C) Unpaired Student’s t-test for the liver volume of wild-type (n = 5) and lvh (n = 5). (D) Unpaired Student’s t-test for the number of hepatocytes per liver of wild-type (n = 5) and lvh (n = 5). (E) Single-optical section images showing livers of the wild-type and lvh mutant at 9 dpf. Higher magnification images of single hepatocytes (dashed frames) are displayed. (F) Unpaired Student’s t-test for single hepatocyte volume in the wild-type (n = 5) and lvh (n = 5). NS, not significant. ****P<0.0001. WT, wild-type. Data are represented as mean±SD. Scale bars, 50 μm. |

The lvh mutant exhibits liver dysfunction under fasting and limited tolerance to starvation. (A) Double labeling of mCherry and BODIPY FL C5 epifluorescence in the wild-type (8/8) and lvh (5/8) liver at 9 dpf. Arrows and arrowheads indicate intrahepatic ducts and lipid droplets, respectively. (B) ORO staining showing fat deposits in the liver of wild-type and lvh at 9 dpf. (C) Expressions of cp in the wild-type and lvh. The dashed frames indicate the liver area. The red arrowheads indicate food in the gut. (D) qPCR data showing the relative expression levels of cp. (E) Expressions of gc in the wild-type and lvh. The dashed frames indicate the liver area. The red arrowheads indicate food in the gut. (F) qPCR data showing the relative expression levels of gc. (G) The survival rates of wild-type, hets and, lvh under feeding or fasting are shown by the Gehan-Breslow-Wilcoxon test. Asterisks indicate statistical significance. NS, not significant. *P<0.05, ****P<0.0001. Data are represented as mean±SD. WT, wild-type. hets, heterozygosity. Scale bars, 50 μm. |
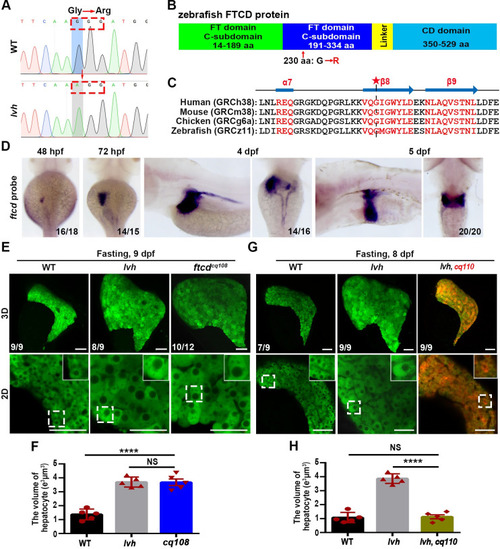
The hepatomegaly of lvh is caused by mutation of ftcd. (A) Sequencing of ftcd from the wild-type and lvh mutant identified a G to A point mutation, resulting in a switch from glycine to arginine at position 691. Red arrow indicates the mutation site. (B) Diagramed FTCD protein structure and the mutation in lvh at FT domain C-subdomain. (C) A conserved β8 motif of FTCD in zebrafish and its homologous proteins in humans, mouse and chicken. Asterisk indicates the site of mutated amino acid in lvh. (D) WISH images showing ftcd expressions at 48 hpf, 72 hpf, 4 dpf, and 5 dpf. (E) 3D confocal projection and 2D single-optical section images showing the liver of wild-type, lvh and, ftcdcq108 at 9 dpf. Higher magnification images of single hepatocytes are displayed. (F) Unpaired Student’s t-test for single hepatocyte volume in the wild-type (n = 5), lvh (n = 5) and cq108 (n = 5). (G) 3D confocal projection and 2D single-optical section images showing the liver of WT, lvh and lvh under cq110 background at 8 dpf. Higher magnification images of single hepatocytes are displayed. (H) Unpaired Student’s t-test for single hepatocyte volume in the wild-type (n = 5), lvh (n = 5) and lvh under cq110 (n = 5). Asterisks indicate statistical significance. ****P<0.0001. Data are represented as mean±SD. WT, wild-type. Scale bars, 50 μm. |
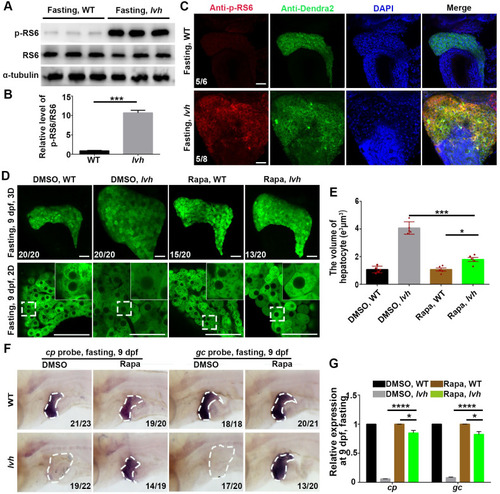
FTCD prevents starvation-induced hepatomegaly through downregulating mTORC1.(A) Western blot analysis of p-RS6 (s240/244), RS6, and α-tubulin using liver lysates (n = 120). (B) Quantification of relative intensity (n = 3) for p-RS6/RS6. (C) Immunostaining for p-RS6 and Dendra2 in livers (3D imaging). Nuclei were stained with DAPI (blue). (D) 3D confocal projection and 2D single-optical section images of the liver. Higher magnification images of single hepatocytes are displayed. (E) Unpaired Student’s t-test for single hepatocyte volume of DMSO and Rapa treatment in the wild-type (n = 5) and lvh (n = 5). (F) The disappeared cp and gc expressions in lvh under fasting were rescued by rapamycin treatment. The dashed boxes indicate the liver area. (G) qPCR data showing the relative expression levels of cp and gc in the wild-type and lvh liver after DMSO and Rapa treatment. Asterisks indicate statistical significance. NS, not significant. *P<0.05, ***P<0.001, ****P<0.0001. Data are represented as mean±SD. WT, wild-type. Rapa, rapamycin. Scale bars, 50 μm |