
|
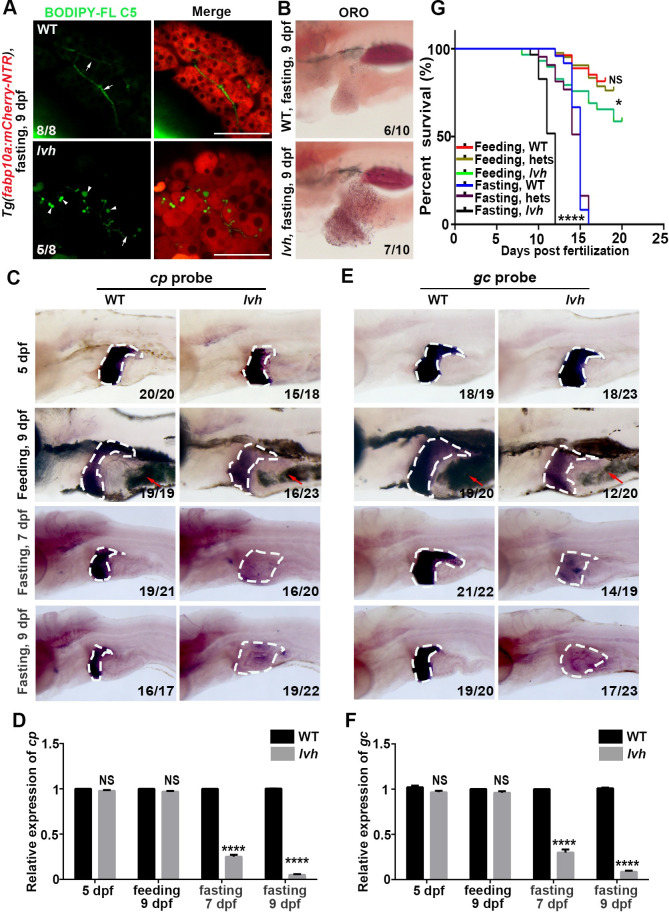
Fig 2 The lvh mutant exhibits liver dysfunction under fasting and limited tolerance to starvation. (A) Double labeling of mCherry and BODIPY FL C5 epifluorescence in the wild-type (8/8) and lvh (5/8) liver at 9 dpf. Arrows and arrowheads indicate intrahepatic ducts and lipid droplets, respectively. (B) ORO staining showing fat deposits in the liver of wild-type and lvh at 9 dpf. (C) Expressions of cp in the wild-type and lvh. The dashed frames indicate the liver area. The red arrowheads indicate food in the gut. (D) qPCR data showing the relative expression levels of cp. (E) Expressions of gc in the wild-type and lvh. The dashed frames indicate the liver area. The red arrowheads indicate food in the gut. (F) qPCR data showing the relative expression levels of gc. (G) The survival rates of wild-type, hets and, lvh under feeding or fasting are shown by the Gehan-Breslow-Wilcoxon test. Asterisks indicate statistical significance. NS, not significant. *P<0.05, ****P<0.0001. Data are represented as mean±SD. WT, wild-type. hets, heterozygosity. Scale bars, 50 μm.