
- Title
-
Real-time evaluation of glioblastoma growth in patient-specific zebrafish xenografts
- Authors
- Almstedt, E., Rosén, E., Gloger, M., Stockgard, R., Hekmati, N., Koltowska, K., Krona, C., Nelander, S.
- Source
- Full text @ Neuro Oncol.

Zebrafish xenografted with patient-derived cells (PDCs) can be monitored in real-time using automatic imaging and image analysis. (A) Experiment workflow. High-throughput injection of GFP-tagged PDCs can be monitored in real-time in six 96-well plates using the IncuCyte S3. (B) Pixel-wise semantic segmentation for tumor localization and post-classification of image types. Left panel: Bright Field; Middle panel: Green Fluorescence; Right panel: post-classification. (C and D) Confusion matrices of post-segmentation image classifications for precision (C) and sensitivity (D). |

GFP-signal measurements are representative of tumor growth. (A) Segmented time series of one representative U3013MG xenograft. Numbers indicate time (in hours) and each image is classified as Valid (green number), Invalid (red number), or Dead (white number). (B) Estimates of exponential tumor growth estimated from (A). (C) and (E) Representative light-sheet and IncuCyte images of U3180MG and U3013MG tumors (green) in zebrafish at 2 and 5 dpf. (D) and (F) Correlating tumor growth measurements of rendered surface volume (n = 20/ PDC, p < .0001 paired t-test) and IncuCyte measurements (n = 144/PDC). (G) Confocal projections showing cell nuclei (DAPI, blue), EdU staining (magenta), and tumor cells (GFP, green) injected into zebrafish at 5 dpf. Arrows indicate proliferative tumor cells. (H) Quantification of the EdU and GFP-positive tumor cell ratio at 5 dpf (n = 6/PDC). |

Patient-derived cells (PDC) specific in vivo growth and survival. (A) Posterior distribution of PDC-specific proliferation rate. (B) PDC-specific effect on survival compared with negative control. (Rhombus: proliferative, Square: invasive, Triangle: non-proliferative). (C) Survival stratified by in vivo tumor proliferation. (D) Posterior distribution of tumor initiation capacity, compared to tumor initiation in orthotopic mouse xenografts. |
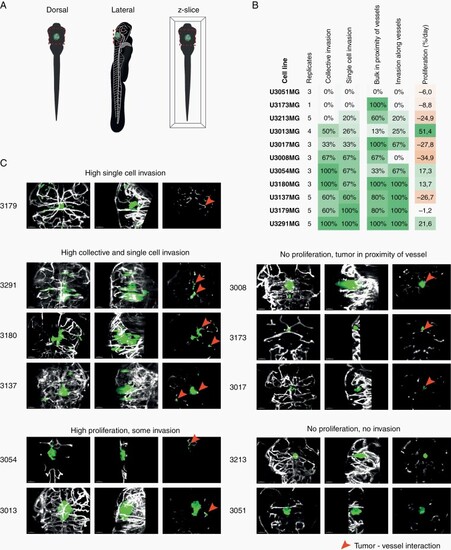
Patient-derived glioblastoma cells (PDC) show heterogenous growth and invasion patterns. (A) Illustration of images in (C). (B) Quantified in vivo characteristics for 11 PDCs. (C) Representative light-sheet (maximum projection) images of the different growth patterns for 11 PDCs in live zebrafish at 5dpf. Left: dorsal; middle: lateral; right: z-slice. Green = GFP, white = mCherry. Scale bars = 50 um. |
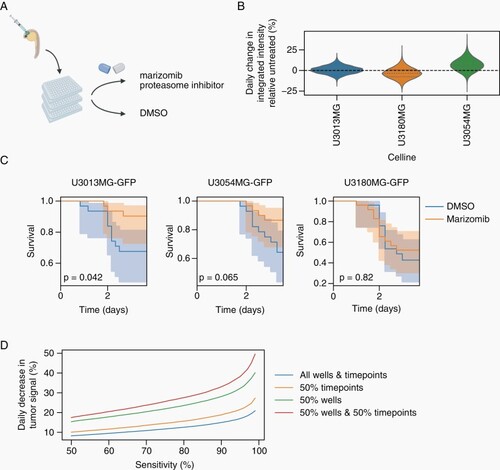
Heterogeneous treatment response is recapitulated in zebrafish xenografts of glioblastoma. (A) Treatment overview. (B) Posterior distribution of in vivo treatment effects for marizomib, compared with untreated, for three PDCs. (C) Survival benefit for treated fish using a Cox model (zones = 95% CI). (D) Power analysis of the zebrafish treatment model. |