

Fig. 1. Schematic representation of the methodological approaches used to evaluate social, anxiety–like behaviors and neurochemical profile in MK-801-treated zebrafish. (Α) Experimental design and endpoints measured. (B–E) The battery of behavioral tests used to analyze zebrafish social and anxiety phenotype. OFT, open field test, NTT, novel tank test, SI, social interaction test, MIS, mirror–induced stimulation test. |

Fig. 2. MK-801-treated zebrafish deficits in social communication and altered glutamatergic neurotransmission. (A-G) Social and non-social parameters using SI test: (A) Representative swimming behavior tracking of control (left) and MK-801-treated (right) zebrafish, (B) SI index, (C) Time spent in social and non–social zone, (D) Number of zone entries, (E) Latency to enter in social zone, (F) Total distance travelled, (G) Average velocity. (H-K) Social parameters estimated by MIS test: (H) representative swimming behavior tracings of control (left) and MK–801-treated (right) zebrafish, (I) MIS index, (J) Number of zone entries, (K) Latency to enter in mirror zone. (L, M) Altered mGluR5 protein levels determined by western blotting in (L) telencephalon and (M) diencephalic/mesencephalic complex in MK-801-treated zebrafish. Data are expressed as mean ± SEM, n = 15 or n = 4 per group for behavioral tests or western blot, respectively. *p ≤ 0.05, **p ≤ 0.01, ***p ≤ 0.001, compared to control group. |

Fig. 3. MK–801-treated zebrafish display anxiety–like behavior, abnormal pattern of repetitive movements and altered catecholaminergic neurotransmission. (A–N) Anxiety-like behavior estimated at OFT and NTT. (A) Representative swimming behavior tracings of control (left) and MK-801-treated (right) zebrafish in OFT, (B) % TDM in the center zone, (C) Time spent in center zone, (D) Number of entries in center zone, (E) Latency to enter in center zone (F) Representative swimming behavior tracings of control (left) and MK–801-treated (right) zebrafish in NTT, (G) Time spent in upper zone, (H) % TDM in upper zone, (I) Latency to enter upper zone, (J) Number of bottom to upper transitions, (K) Freezing duration, (L) Freezing frequency, (M) Total distance travelled, (N) Average velocity (0) A representative example of movements considered repetitive is illustrated above. Increased frequency of stereotyped movements in MK–801 zebrafish (P–Q) Altered β2-adrenoceptors (P) and DAT (Q) protein expression levels determined by western blotting in telencephalon and in the diencephalic/mesencephalic complex of MK-801-treated zebrafish. Data are expressed as mean ± SEM, n = 15 or n = 8–10 per group for behavioral tests or western blot analysis, respectively. *p ≤ 0.05, **p ≤ 0.01, ***p ≤ 0.001, compared to controls. |
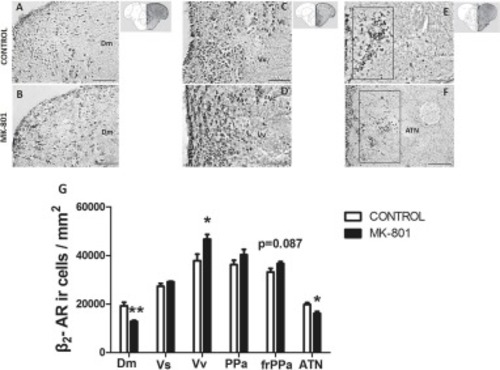
Fig. 4. Altered noradrenergic activity across the SDM network, in MK–801-treated zebrafish displaying social withdrawal and anxiety–like behavior. (A-F) Representative staining for β2-ΑRs in (A, B) medial zone of the dorsal telencephalic area (Dm), (C-D) ventral nucleus of ventral telencephalic area (Vv) and (E-F) anterior tuberal nucleus (ATN) of control and MK–801-treated fish. Scale bar: 0.05 mm. (G) The density of β2-ΑRs positive cells in MK-801-treated zebrafish, in brain nuclei of the SDM network, compared to control group. Bars represent the number (mean ± s.e.m.) of β2-ΑRs positive cells. n = 4 per group. *p ≤ 0.05, **p ≤ 0.01, compared to control group. |

Fig. 5. Immunofluorescent microphotographs of selected transverse sections showing colocalization of β2-ΑRs on mGluR5 expressing cells, across the SDM network. (A-E) Double immunofluorescence showing high degree of colocalization of β2-ΑRs (red) and mGluR5 (green) in (A) ventral nucleus of the ventral telencephalic area (Vv), (B) medial zone of the dorsal telencephalic area (Dm), (C) parvocellular preoptic nucleus, anterior part (PPa), (D) anterior tuberal nucleus (ATN). (E) Noradrenergic, β2-ΑRs positive cell bodies in LC, express mGluR5. Arrows indicate examples of colocalization, arrowheads point to single positive cells. Notice the frequent colocalization. Microphotographic images are representative of both control (A, B) and MK–801 (C, D, E) fish. Scale bar: 0,05 mm. (For interpretation of the references to colour in this figure legend, the reader is referred to the web version of this article.) |

Fig. 6. Immunofluorescent microphotographs of selected transverse sections showing colocalization of β2-ΑRs on GAD67 expressing cells, across the SDM network. (A-C) Double immunofluorescence showing high degree of colocalization between β2-ΑRs (green) and GAD67 (red) in (A) ventral nucleus of the ventral telencephalic area (Vv), (B) medial zone of the dorsal telencephalic area (Dm), (C) parvocellular preoptic nucleus, anterior part (PPa). Arrows indicate examples of colocalization, arrowheads point to single positive cells. Microphotographic images are representative of both control (B, C) and MK–801-treated (A) fish. Scale bar: 0,05 mm. (For interpretation of the references to colour in this figure legend, the reader is referred to the web version of this article.) |

Fig. 7. Immunofluorescent microphotographs of selected transverse sections showing colocalization of β2-ΑRs with Growth Associated Protein 43 (GAP-43) expressing cells, across the SDM network. (A-E) Double immunofluorescence staining showing β2-ΑRs positive cells (green) receiving synaptic inputs (arrows) or being in close proximity (dashed arrows) from/with GAP-43 positive cells (red) in (A) medial zone of the dorsal telencephalic area (Dm), (B) ventral nucleus of the ventral telencephalic area (Vv), (C) parvocellular preoptic nucleus, anterior part (PPa), (D) parvocellular preoptic nucleus, posterior part (PPp) and (E) anterior tuberal nucleus (ATN). The arrowheads point to single positive cells. Microphotographic images are representative of control zebrafish. Scale bar: 0,05 mm. (For interpretation of the references to colour in this figure legend, the reader is referred to the web version of this article.) |