
|
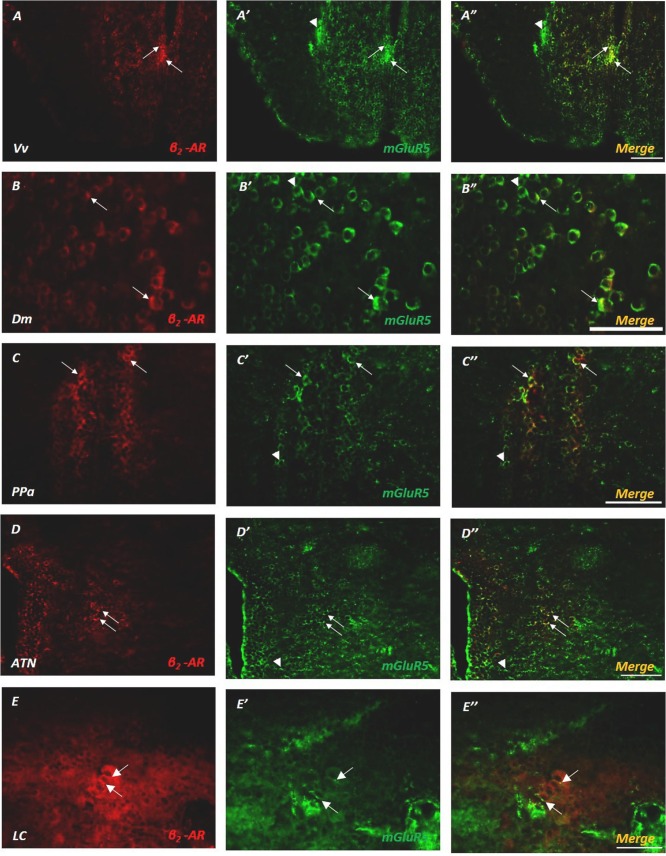
Fig. 5 Fig. 5. Immunofluorescent microphotographs of selected transverse sections showing colocalization of β2-ΑRs on mGluR5 expressing cells, across the SDM network. (A-E) Double immunofluorescence showing high degree of colocalization of β2-ΑRs (red) and mGluR5 (green) in (A) ventral nucleus of the ventral telencephalic area (Vv), (B) medial zone of the dorsal telencephalic area (Dm), (C) parvocellular preoptic nucleus, anterior part (PPa), (D) anterior tuberal nucleus (ATN). (E) Noradrenergic, β2-ΑRs positive cell bodies in LC, express mGluR5. Arrows indicate examples of colocalization, arrowheads point to single positive cells. Notice the frequent colocalization. Microphotographic images are representative of both control (A, B) and MK–801 (C, D, E) fish. Scale bar: 0,05 mm. (For interpretation of the references to colour in this figure legend, the reader is referred to the web version of this article.)