
- Title
-
Tbx5a and Tbx5b paralogues act in combination to control separate vectors of migration in the fin field of zebrafish
- Authors
- Anderson, E.B., Mao, Q., Ho, R.K.
- Source
- Full text @ Dev. Biol.
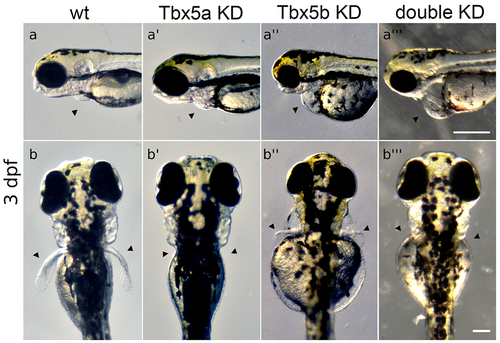
Tbx5 knock-down embryos display heart and pectoral fin defects. (a-a’’’) Arrowheads point to position of heart. Views are lateral with anterior to the left. Scale bar=250μm. (a) Normal wt heart development. (a’) Tbx5a-knock-down embryos display edema and defects in heart looping. (a’’) Tbx5b-knock-down embryos display edema and defects in heart looping. (a’’’) Double knock-down embryos have linear hearts and edema, (b-b’’’) Arrowheads point to normal position of pectoral fins. Views are from dorsal aspect with anterior to the top. Scale bar=100μm. (b) Wt embryo showing both fins at 3 days post-fertilization (dpf). (b’) Tbx5a knock-down embryos lack pectoral fins, (b’’) Tbx5b knock-down embryos display small, misshapen fins. (b’’’) Tbx5a/Tbx5b double knock-down embryos do not form pectoral fins. Panels a, a’’, b and b’’ reproduced from Boyle Anderson and Ho (2018). |
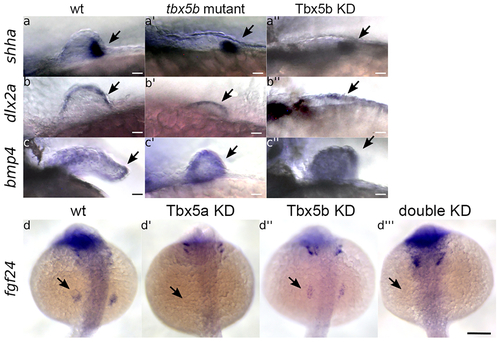
Tbx5b mutants and knock-downs express early fin bud signaling molecules.
(a-c’’) Lateral views with anterior to the left. Scale bars=10 μm. (a-a’’) shha (arrows) is expressed in the posterior mesenchyme of the fin bud at 32 hours post fertilization (hpf) in wt embryos (a), tbx5b mutant (a’), and Tbx5b knock-down (a’’) embryos. (b-b’’) dlx2a (arrows) is expressed in the AER of the fin bud at 32 hpf in the wt (b), tbx5b mutant (b’) and Tbx5b knock-down (b’’) embryos, (c-c’’) bmp4 (arrows) is expressed in the wt fin at 48 hpf (c). tbx5b mutant (c’) and Tbx5b knock-down (c’’) embryos, (d-d’’’) Arrows indicate the normal location of fgf24 expression in the fin field at 21 hpf. Embryos are shown in a dorsal view with anterior to the top. Scale bar =100μm. (d) fgf24 is expressed in the fin field of wildtype embryos. (d’) fgf24 is absent from the fin field of Tbx5a knock-down embryos. (d’’) fgf24 expression is decreased in the fin field of Tbx5b knock-down embryos. (d’’’) fgf24 expression is absent in double knock-down embryos. |
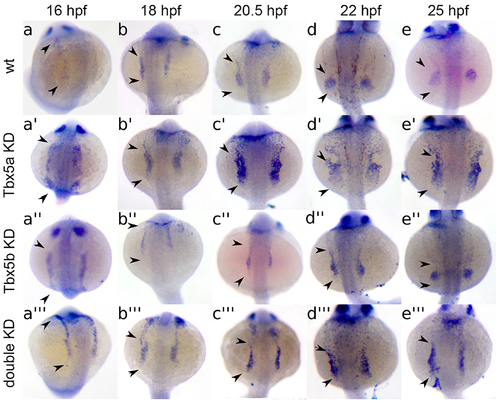
Fin field expression of tbx5a is altered in knock-downs.
Embryos are shown in a dorsal view with anterior to the top. Embryos are at 16 hpf (a, a’, a’’, a’’’), 18 hpf (b, b’, b’’, b’’’), 20.5 hpf (c, c’, c’’, c’’’), 22 hpf (d, d’, d’’, d’’’), and 25 hpf (e, e’, e’’, e’’’). Control embryos are either uninjected wt (a) or wt injected with a control morpholino (b-e), and show a condensing in the shape of the pectoral fin field tbx5a expression to a circular shape over time. (a’-e’) Tbx5a knock-down embryos display a lack of condensing of pectoral tbx5a expression over time, leading to wider, more scattered expression pattern. (a’’-e’’) Tbx5b knock-downs display a delay in the condensing of pectoral fin bud tbx5a expression over time to a disc pattern. (a’’’-e’’’) Double knock-downs display a relatively constant expression pattern of tbx5a over time. Arrowheads in a-a’’’ indicate the extent of continuous tbx5a expression before the separation of the fin field region from more anterior LPM. Arrowheads in b-e’’’ indicate the extent of tbx5a expression in the fin field. Width of yolk approximately equals 500μm. |
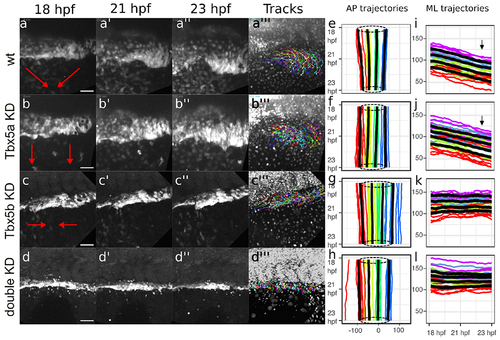
Cell tracking analyses showing loss of ML cell movements in Tbx5a, Tbx5b and double knock-downs.
Red arrows depict the general overall movement of the fin field cells. (a-a”’) The cells of the wt fin field both converge along the AP axis and migrate along the ML axis to condense at the site of the limb bud. (b-b”’) Tbx5a knock-down cells migrate laterally but do not converge along the AP axis. (c-c”’) Tbx5b knock-down cells converge along the AP axis but do not migrate laterally. (d-d”’) double-knock-down cells appear to neither migrate laterally nor converge along the AP axis. (a”’, b”’, c”’, d”’) shows the tracks overlaid over the nuclei at the final frame tracked for each respective movie (see supplemental figure for enlargement of these panels). All stills from time-lapse movies show the LPM fin field oriented with anterior to the left and dorsal towards top. (e-h) Spaghetti plots depict the mean AP position of LPM cells adjacent to somite 1-4. Each colored line represents the mean relative AP position of cells for each embryo, shown on x-axis plotted relative to time on the y-axis with red representing cells adjacent to somite 1, yellow representing cells adjacent to somite 2, green representing cells adjacent to somite 3, and blue representing cells adjacent to somite 4. Bold black lines represent composite averages across all embryos from each group. Dotted circles denote average AP extent of limb-field domains at 18 hpf (top) and 23 hpf (bottom) to highlight convergence movements. (i-l) Spaghetti plots show the mean ML position for cells divided into 4 equal quartiles. Each colored line represents the mean ML position for each embryo, with red representing cells in the first quartile, green representing cells in the second quartile, blue representing cells in the third quartile and purple representing cells in the fourth quartile. The black lines represent the mean ML position for cells adjacent to each somite across all embryos for that grouping, with relative positions of cells plotted on the y-axis against time on the x-axis. (e, i) wt. (f, j) Tbx5a knock-downs. (g, k) Tbx5b knock-downs. (h, l) Double Tbx5a/Tbx5b knock-downs. Scale bars=50 μm. |
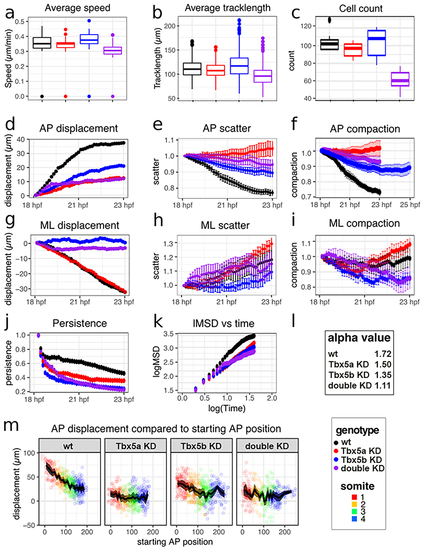
Cell tracking statistics show that knock-down cells are still able to migrate but lose aspects of directed movement.
For graphs a-k, the ‘genotype’ key at bottom right shows that black represents wt data, red represents Tbx5a knock-down data, blue represents Tbx5b knock-down data and purple represents double knock-down data. The ‘somite’ key at bottom right refers to panel m. Error bars represent standard error. (a) Boxplots depicting average speed of each time cell at each time point per embryos (b) Boxplots depicting average track length per genotype. (c) Boxplots depicting the average number of cells in the fin field. (d) AP displacement over time, displacement is in μm. (e) Scatter along the AP axis over time. (f) AP compaction factor over time. (g) ML displacement over time. (h) ML scatter over time. (i) ML compaction factor over time. (j) Persistence plotted over time. (k) Log mean square displacement versus log time. (l) Average alpha value calculated from previous plot of lMSD vs time. (m) Each colored point represents the total displacement for a single track with respect to starting position. The black line represents the mean displacement with respect to starting position, with the surrounding shaded region representing the 95% confidence interval. |

Tbx5b knock-down, anterior fin field cells fail to migrate into the fin bud.
(a-b) Maximal intensity projections of representative fin buds at 30 hpf of Tg(Tbx5a::GFP) embryos. The fin bud is outlined in red. Anterior is to the left, the dorsal midline is up. Representative images are shown for both (a) uninjected and (b) Tbx5b knock-down embryos. (c-h) Measurements of the area of GFP+ expressing cells. For both conditions, n=8 embryos/16 limb buds. (c) There is no significant difference in the total area of GFP+ expressing cells between wt and Tbx5b knock-down embryos. (d) There is a significant (p<0.01) difference in the area of GFP+ expressing cells in the fin bud between wt and Tbx5b knock-down embryos. (e) There is a significant difference (p<0.05) in the area containing GFP+ expressing cells outside of the fin bud between wt and Tbx5b knock-down embryos. (f) There is a significant difference (p<0.05) in the area of GFP+ cells located rostrally to the fin bud between wt and Tbx5b knock-down embryos. There is no significant difference between wt and Tbx5b knock-downs in the area of GFP+ expressing cells located either (g) adjacent to or (h) posterior to the fin bud. |
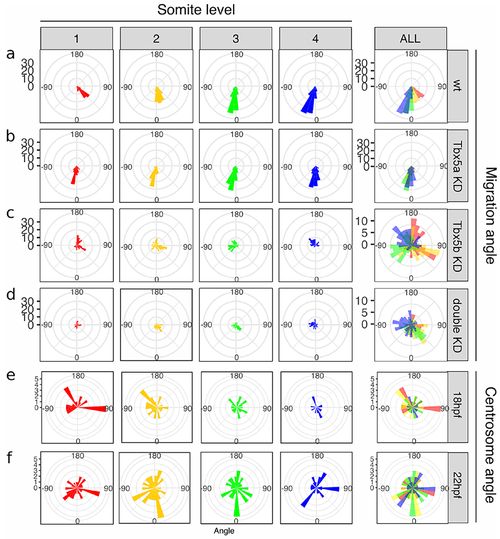
Cellular movements are randomized in Tbx5b and double knock-down embryos.
The rose diagrams in a-d represent the angle of migration with respect to the ML axis. Angles are divided along the AP axis, with cells adjacent to somite 1 in red, cells adjacent to somite 2 in yellow, cells adjacent to somite 3 in green and cells adjacent to somite 4 in blue. (a) Wildtype embryos show a directed migration, with different angles of migration for somites 1-4. (b) Tbx5a knock-down embryos display equivalent angles of migration across the AP axis. (c) Tbx5b knock-down embryos show wt-like angles of migration along the AP axis, but randomized ML movements. (d) Double knock-down embryos display both AP and ML changes to the angles of cell migration across all positions. (e-f) Angle of xCentrin::RFP expression with respect to the nucleus in the cells of the wt fin field. (e) In 18 hpf embryos, the angle of xCentrin::RFP expression with respect to the nucleus displayed no significant bias in angle. (f) At 22 hpf, the angle of xCentrin::RFP with respect to the nucleus displayed no significant bias in angle. |
Reprinted from Developmental Biology, 481, Anderson, E.B., Mao, Q., Ho, R.K., Tbx5a and Tbx5b paralogues act in combination to control separate vectors of migration in the fin field of zebrafish, 201-214, Copyright (2021) with permission from Elsevier. Full text @ Dev. Biol.