
- Title
-
Podocyte-specific Crb2 knockout mice develop focal segmental glomerulosclerosis
- Authors
- Tanoue, A., Katayama, K., Ito, Y., Joh, K., Toda, M., Yasuma, T., D'Alessandro-Gabazza, C.N., Kawachi, H., Yan, K., Ito, M., Gabazza, E.C., Tryggvason, K., Dohi, K.
- Source
- Full text @ Sci. Rep.

Generation of podocyte-specific Crb2 knockout mice. (a) Two loxP sites were inserted into introns 6 and 8 of the Crb2 gene to skip exons 7 and 8 in the Crb2 floxed allele. (b) While there was a 353-bp band with Crb2 primers in Crb2fl/fl mice and Crb2fl/flpod-CreTg/+ mice, there was a 153-bp product in Crb2+/+pod-CreTg/+ mice. There was a 102-bp band with pod-Cre primers in Crb2+/+pod-CreTg/+ mice and Crb2fl/flpod-CreTg/+ mice. (c) There were a strong band between 140–180 kDa and a weak band between 180–245 kDa markers with CRB2 antibody in the glomeruli from Crb2+/+pod-CreTg/+ mice or Crb2fl/fl mice, while these bands were invisible in those of Crb2fl/flpod-CreTg/+ mice at 2 months of age. The band of β-actin was similar among the three groups. (d) Synpo, a podocyte marker, was co-localized with Crb2 in Crb2+/+pod-CreTg/+ or Crb2fl/fl mice. No co-localization of Crb2 and Synpo was observed in Crb2fl/flpod-CreTg/+ mice. Scale bars 20 μm. |

Podocyte-specific Crb2 knockout mice develop massive albuminuria and microhematuria at 2 months of age. (a) Massive albuminuria was observed at 2 months of age in Crb2fl/flpod-CreTg/+ mice compared to Crb2+/+pod-CreTg/+ or Crb2fl/fl mice. Microhematuria was observed at 2 months of age in Crb2fl/flpod-CreTg/+ mice compared to Crb2+/+pod-CreTg/+ or Crb2fl/fl mice. (b) The blood urea nitrogen and serum creatinine levels were comparable among the three groups at 2 months of age. (c) The sclerotic indices were comparable among the three groups at 2 months of age. Scale bars 50 μm. (d) The fibrotic indices were comparable among the three groups at 2 months of age. Scale bars 100 μm. Data are presented as mean ± SD. Statistical analysis by one-way analysis of variance, followed by Scheffe's multiple comparison test; n = 6 in each group. **P < 0.01, ****P < 0.0001. |

Podocyte-specific Crb2 knockout mice develop FSGS at 6 months of age. (a) Massive albuminuria was observed at 6 months of age in Crb2fl/flpod-CreTg/+ mice compared to Crb2+/+pod-CreTg/+ or Crb2fl/fl mice. Microhematuria was observed at 6 months of age in Crb2fl/flpod-CreTg/+ mice compared to Crb2+/+pod-CreTg/+ or Crb2fl/fl mice. (b) The blood urea nitrogen and serum creatinine levels were comparable among the three groups at 6 months of age. (c) The sclerotic indices in Crb2fl/flpod-CreTg/+ mice were significantly higher than those in Crb2+/+pod-CreTg/+ or Crb2fl/fl mice. Scale bars 50 μm. (d) The fibrotic indices in Crb2fl/flpod-CreTg/+ mice were significantly higher than those in Crb2+/+pod-CreTg/+ or Crb2fl/fl mice. Scale bars 100 μm. Data are presented as mean ± SD. Statistical analysis by one-way analysis of variance, followed by Scheffe's multiple comparison test; n = 6 in each group. ***P < 0.001, ****P < 0.0001. |
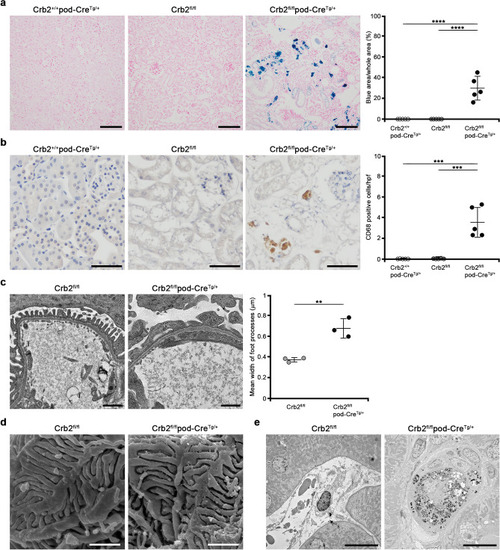
Hemosiderin accumulation and CD68-positive cells in the interstitium of podocyte-specific Crb2 knockout mice at 6 months of age and electron microscopic study. (a) The blue area was significantly larger in Crb2fl/flpod-CreTg/+ mice than in Crb2+/+pod-CreTg/+ or Crb2fl/fl mice. Scale bars 100 μm. (b) The brown cells in the interstitium of Crb2fl/flpod-CreTg/+ mice were positive for CD68, suggesting that they were macrophages. CD68-positive cells were significantly more frequent in the interstitium of Crb2fl/flpod-CreTg/+ mice than in that of Crb2+/+pod-CreTg/+ or Crb2fl/fl mice. HPF high-power field. Scale bars 50 μm. Data are presented as mean ± SD. Statistical analysis by one-way analysis of variance, followed by Scheffe's multiple comparison test; n = 5 in each group. ***P < 0.001, ****P < 0.0001. (c) Transmission electron microscopy showed foot process effacement in Crb2fl/flpod-CreTg/+ mice compared to Crb2fl/fl mice. Scale bars 1 μm. The mean width of the foot processes in Crb2fl/flpod-CreTg/+ mice was significantly greater than that in Crb2fl/fl mice. Data are presented as mean ± SD. Statistical analysis by Student's t-test; n = 3 in each group. **P < 0.01. (d) Scanning electron microscopy showed damage to the foot processes' urinary sides in Crb2fl/flpod-CreTg/+ mice compared to Crb2fl/fl mice. Scale bars 1 μm. (e) Hemosiderin-laden macrophages were observed in the interstitial area of Crb2fl/flpod-CreTg/+ mice, but not in that of Crb2fl/fl mice, at 6 months of age. Scale bars 10 μm. |

The protein expressions of Nphs2, Podxl, and Nphs1 and the number of Wt1 positive cells in the glomeruli were decreased in podocyte-specific Crb2 knockout mice. (a) An immunofluorescence study showed that Nphs2, Podxl, and Nphs1 expression significantly decreased in Crb2fl/flpod-CreTg/+ mice compared to Crb2fl/fl mice. Scale bars 50 μm. (b) The protein expressions of Nphs2, Podxl, and Nphs1 were significantly decreased in Crb2fl/flpod-CreTg/+ mice compared to Crb2fl/fl mice. (c) Wt1-positive cells were significantly decreased in the glomeruli of Crb2fl/flpod-CreTg/+ mice compared to those of Crb2fl/fl mice. Data are presented as mean ± SD. Statistical analysis by Student's t-test; n = 5 in each group. *P < 0.05, **P < 0.01, ****P < 0.0001. |
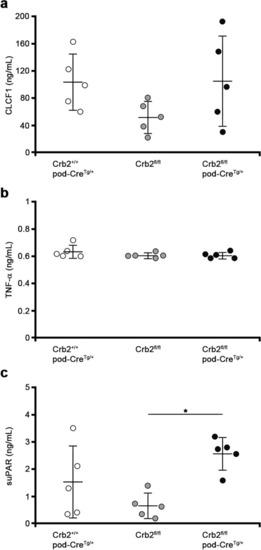
The circulating permeability factors in the mouse serum samples at 6 months of age. (a) The serum levels of CLCF1 were comparable among the three groups. (b) The serum levels of TNF-α were comparable among the three groups. (c) The serum levels of suPAR were significantly elevated in the Crb2fl/flpod-CreTg/+ mice compared to the Crb2fl/fl mice while there was no significant difference between serum levels of the Crb2fl/flpod-CreTg/+ mice and the Crb2+/+pod-CreTg/+ mice. Data are presented as the mean ± SD. The statistical analysis was performed by a one-way analysis of variance, followed by Scheffe's multiple comparison test; n = 5 in each group. *P < 0.05. CLCF1 cardiotrophin like cytokine factor 1, TNF-α tumor necrosis factor-α, suPAR soluble urokinase-type plasminogen activator receptor. |
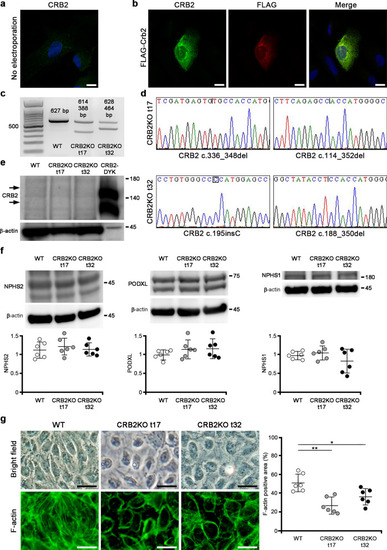
Generation of CRB2 knockout human immortalized podocytes. ( |

Apoptosis and adhesion assay. ( |