FIGURE SUMMARY
Title

A mutant wfs1 zebrafish model of Wolfram syndrome manifesting visual dysfunction and developmental delay

Authors
Cairns, G., Burté, F., Price, R., O'Connor, E., Toms, M., Mishra, R., Moosajee, M., Pyle, A., Sayer, J.A., Yu-Wai-Man, P.
Source
Full text @ Sci. Rep.

ZFIN is incorporating published figure images and captions as part of an ongoing project. Figures from some publications have not yet been curated, or are not available for display because of copyright restrictions.

EXPRESSION / LABELING:
Genes:
Fish:
Anatomical Terms:
Stage Range: 1-cell to Adult

Phenotypic analysis of wfs1a−/− and wfs1b−/− zebrafish. (A) Zebrafish were imaged at 30, 50 and 80 hpf. Scale bars represent 1 mm. (B–D) Zebrafish length at 30 hpf (B), 50 hpf (C) and 80 hpf (D). (E,F) Zebrafish head-trunk angles at 50 hpf (E) and 80 hpf (F). Zebrafish length and head tail angle was measured using ImageJ and data plots represent mean ± SEM (n = 10). Statistical significance was determined by One-Way ANOVA with Bonferroni multiple comparisons. **p < 0.01; ***p < 0.001; hpf hours post-fertilisation, SEM standard error of the mean.

Effects of the unfolded protein response in wfs1a−/− and wfs1b−/− zebrafish. Treated zebrafish were heat shocked for 1 h at 6 hpf (groups of 50 embryos). (A) Representative images of the morphological effects for each genotype at 80 hpf. Scale bar = 1 mm. (B) Percentage of dead zebrafish at 24 hpf. Data plots represent mean ± SEM (n = 5 groups of 50). Statistical significance was determined by One-Way ANOVA with Bonferroni multiple comparisons. (C) Immunoblot of BiP in untreated and heat shocked zebrafish showing an upregulation of BiP in response to heat shock. Coomassie staining demonstrates equal loading. *p < 0.05; **p < 0.01; ****p < 0.0001; h/s: heat shock treated.

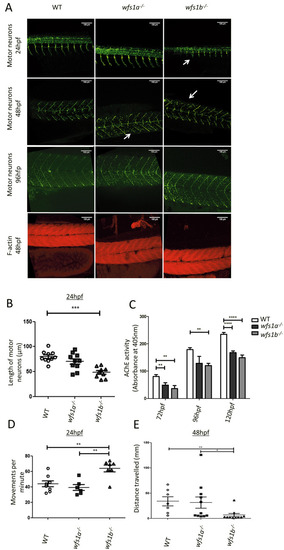
Neuronal development in wfs1a−/− and wfs1b−/− zebrafish. (A) Immunofluorescence of motor neurons (SV-2 stained using anti-SV2 antibody in green) and muscle fibres (F-actin stained using phalloidin in red). Shorter or missing neurons are highlighted with white arrows. (B) Quantification of the length of motor neurons in 24 hpf zebrafish (WT n = 10; wfs1a n = 11; wfs1b n = 9). For each fish, 9–10 neurons were measured and the average length was calculated. (C) Acetylcholine esterase (AChE) activity assay of developing zebrafish larvae (3–5 dpf). (D) Coiling response of zebrafish embryos at 24 hpf. The average movement per fish per minute was calculated from ~ 15 embryos (WT n = 8; wfs1a n = 6; wfs1b n = 7) (Supplementary Video 1). (E) Quantification of the touch response of zebrafish embryos at 48 hpf. The distance travelled was recorded in response to tactile stimulation (WT n = 8; wfs1a n = 11; wfs1b n = 10) (Supplementary Video 2). Data plots represent mean ± SEM. Statistical significance was calculated using One-way ANOVA with Bonferroni’s multiple comparison tests. **p < 0.01; ***p < 0.001; ****p < 0.0001; dpf days post-fertilisation.

Retinal ganglion cell count and visual function in wfs1a−/− and wfs1b−/− zebrafish. (A) Representative images of WT, wfs1a−/− and wfs1b−/− retinal sections at 4 months of age (scale bar = 20 µm). For RGC counts, 6 boxes of the same area (100 μm2) were used with 3 boxes on either side of the optic nerve. The number of RGC cell bodies were counted and averaged. (B) RGC count per 100 μm2 at 4 months of age (WT n = 8; wfs1a−/− n = 10; wfs1b−/− n = 9). (C) RGC count per 100 μm2 at 12 months of age (WT n = 10; wfs1a−/− n = 9; wfs1b−/− n = 9). Data plots represent mean ± SEM. Statistical significance was calculated using the Kruskal–Wallis test (One-way ANOVA on ranks). (D) Optical coherence tomography (OCT) images of retinal cross-sections from 12-month-old zebrafish showing significant thinning of the ganglion cell layer (GCL) in wfs1a−/− and wfs1b−/− zebrafish (arrow). (E) Measurement of GCL area (WT mean = 29,393 ± 2653 μm2; wfs1a−/− mean = 23,688 ± 3332 μm2; wfs1b−/− mean = 21,363 ± 1,737 μm2; n = 3 for all 3 groups). Data plots represent mean ± SEM. Statistical significance was calculated using One-way ANOVA with Bonferroni’s multiple comparison tests. (F–I) Optokinetic response (OKR) of 4- and 12-month-old fish tested at 8 rpm and 16 rpm. Videos were recorded of fish eye tracking and the movements were manually counted (Supplementary video 3). Data plots represent mean ± SEM. Statistical significance was calculated using One-way ANOVA with Bonferroni’s multiple comparison tests. *p < 0.05; **p < 0.01; ***p < 0.005; ****p < 0.001; rpm: revolutions per minute.

Fertility of wfs1a−/− and wfs1b−/− zebrafish. (A) Percentage of dead embryos at 24 hpf produced from adults < 9 months (n = 9). (B) Percentage of dead embryos at 24 hpf produced from adults > 9 months (n = 9). (C) Percentage of dead embryos at 24 hpf in randomly selected embryos from wfs1b−/− zebrafish (male or female) that were outcrossed to WT (controls n = 9, wfs1b−/− outcrosses n = 7). A total of 50 randomly selected embryos were placed in E3 medium, incubated overnight and any dead embryos were determined the next morning. Data plots represent mean ± SEM. Statistical significance was determined by One-Way ANOVA with Bonferroni multiple comparisons. **p < 0.01; ***p < 0.001; ****p < 0.0001.

Unillustrated author statements

Acknowledgments
This image is the copyrighted work of the attributed author or publisher, and ZFIN has permission only to display this image to its users. Additional permissions should be obtained from the applicable author or publisher of the image. Full text @ Sci. Rep.